Download
1 / 20
200 likes | 203 Views
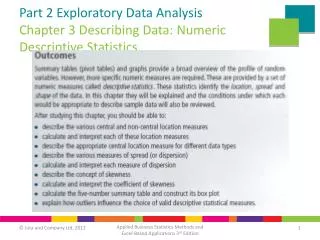
This chapter explores different types of statistics and frequency distributions, including their construction and graphical representation. It also covers measures of central tendency and variability, as well as correlation procedures.

E N D
Types of Statistics Descriptive statistics Used to describe and synthesize data Inferential statistics Used to make inferences about the population based on sample data
Frequency Distributions • A systematic arrangement of numeric values on a variable from lowest to highest, and a count of the number of times each value was obtained • Frequency distributions can be described in terms of: • Shape • Central tendency • Variability
Construction of Frequency Distributions • Can be presented in tabular form (counts and percentages) • Can be presented graphically • Histograms • Frequency polygons
Shapes of Distributions • Symmetry • Symmetric • Skewed (asymmetric) • Positive skew (long tail points to the right) • Negative skew (long tail points to the left)
Shapes of Distributions (cont.) • Peakedness (how sharp the peak is) • Modality (number of peaks) • Unimodal (1 peak) • Bimodal (2 peaks) • Multimodal (2+ peaks)
Modality • Symmetric • Unimodal • Not too peaked, not too flat
Distribution of Values: Central Tendency Index of “typicalness” of set of scores that comes from center of the distribution Mode—the most frequently occurring score in a distribution 2 3 3 3 4 5 6 7 8 9 Mode = 3
Distribution of Values: Central Tendency (cont.) • Median—the point in a distribution above which and below which 50% of cases fall 2 3 3 3 4 5 6 7 8 9 Median = 4.5 • Mean—equals the sum of all scores divided by the total number of scores 2 3 3 3 4 5 6 7 8 9 Mean = 5.0
Indexes of Central Tendency • Mode, useful mainly as gross descriptor, especially of nominal measures • Median, useful mainly as descriptor of typical value when distribution is skewed • Mean, most stable and widely used indicator of central tendency
Variability of Distributions The degree to which scores in a distribution are spread out or dispersed • Homogeneity—little variability • Heterogeneity—great variability
Indexes of Variability • Range: highest value minus lowest value • Standard deviation (SD): average deviation of scores in a distribution • Variance: a standard deviation, squared
Contingency Table (or Crosstab) • A two-dimensional frequency distribution; frequencies of two variables are cross-tabulated • “Cells” at intersection of rows and columns display counts and percentages • Variables must be nominal or ordinal
Contingency Table for Gender and Smoking Status Relationship
Correlation Procedures • Indicate direction and magnitude of relationship between two variables • Used with ordinal, interval, or ratio measures • Can be shown graphically (scatter plot) • Correlation coefficient (usually Pearson’s r) can be computed • With multiple variables, a correlation matrix can be displayed