Download
1 / 27
270 likes | 434 Views
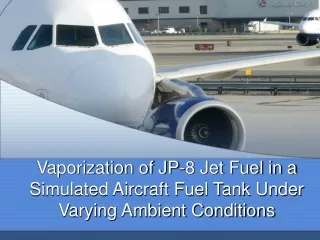
MULTI-COMPONENT FUEL VAPORIZATION IN A SIMULATED AIRCRAFT FUEL TANK. C. E. Polymeropoulos Department of Mechanical and Aerospace Engineering, Rutgers University 98 Bowser Rd Piscataway, New Jersey, 08854-8058, USA Email: poly@jove.rutgers.edu. MOTIVATION.

E N D
MULTI-COMPONENT FUEL VAPORIZATION IN A SIMULATED AIRCRAFT FUEL TANK C. E. Polymeropoulos Department of Mechanical and Aerospace Engineering, Rutgers University 98 Bowser Rd Piscataway, New Jersey, 08854-8058, USA Email: poly@jove.rutgers.edu
MOTIVATION • Generation of a flammable mixture within aircraft center fuel tank may result in explosion hazard • Experimentation with Jet A vaporization in an instrumented laboratory tank has been used to assess the effect of different test conditions on the resulting fuel vapor concentrations (Summer, 1999) • Evaluation of the experimental results (Summer, 1999) requires analytical consideration of: • the influence of different experimental parameters • the multi-component fuel vaporization
OUTLINE • Brief discussion of the experiment and of the results (Summer, 1999) • Description of the semi-empirical model • Results and comparison with data • Conclusions
EXPERIMENTAL CONDITIONS/DATA • Mass loading (mass of liquid/tank volume): 0.08 - 5.46 kg fuel/m3 • Fuel pan area : 0.09 m2 - 2.05 m2 • Mean liquid temperature: 52 °C • Unheated tank walls • Data: Temporal evolution of the liquid, gas, and wall temperatures, and of the total propane equivalent HC concentration
Temporal Variation of Gas, Liquid and Mean Wall Temperatures, and of Propane Equivalent Hydrocarbon Concentration
PREVIOUS EXPERIMENTAL FINDINGS(Summer, 1999) • Propane equivalent hydrocarbon concentration reached a maximum steady value which increased with mass loading • The time for reaching maximum hydrocarbon concentration decreased with increasing mass loading • Measured hydrocarbon concentrations were lower than those expected with equilibrium vaporization at the liquid temperature (Woodrow, 1977, Shepherd, 1977)
PHYSICAL CONSIDERATIONS • 3D natural convection heat and mass transfer within the tank. • Tank dimensions: W/D = 2.4 , H/D =1.3 • Liquid vaporization • Vapor condensation • Multicomponent vaporization and condensation
PREVIOUS WORK • Numerous previous investigations of heat transfer within enclosures • Review papers: Catton (1978), Hoogendoon (1986), Ostrach (1988), etc. • Correlations • Few studies of heat and mass transfer within enclosures: • Single component fuel evaporation in a fuel tank, Kosvic et al. (1971) • Computation of single component liquid evaporation within cylindrical enclosures, Bunama, Karim et al. (1997, 1999)
MAJOR ASSUMPTIONS • Well mixed gas and liquid phases • Uniformity of temperatures and species concentrations the gas and evaporating fuel • Rag ≈109 , Ral ≈ 105-106 • Use of experimental liquid, gas, and wall temperatures • Mass transport using heat transfer correlations and the analogy between heat and mass transfer for estimating film mass transfer coefficients • Low evaporating species concentrations • Approximate liquid Jet A composition based on previous published data and and adjusted to reflect equilibrium vapor data
Assumed Jet A CompositionBased on data by Clewell, 1983, and adjusted to reflect for the presence of lower than C8 components
Effect of Fuel Loading on Measured and ComputedPropane Equivalent Fuel Vapor Concentrations
Effect of Fuel Loading on ComputedFuel Vapor to Air Mass Ratio
Effect of Fuel Loading on ComputedFuel to Vapor Molecular Weight
Effect of Fuel Loading on the Steady State Vapor Mole Fraction
CONCLUSIONS • A semi-empirical model of Jet A vaporization together with previous experimental temperature data were used to compute the evolution of multi-component fuel vapor within the test tank ullage • The liquid species composition was based on previous data adjusted to yield reasonable agreement with measured equilibrium vapor compositions at different fuel loadings • There was good agreement between computed and experimental total vapor concentrations • Computed results showed that steady state vapor concentration in the test tank was reached when the rate of vaporization equaled the rate of condensation on the tank walls
CONCLUSIONS (continued) • Condensation on the tank walls had a strong influence on the ullage vapor concentration • Depletion of light components as the fuel loading was decreased resulted in increase of the molecular weight of the resulting mixture • For the cases considered computed vapor to air mass ratios ratios were in good agreement with those calculated from experimental propane equivalent PPM data using a constant fuel vapor MW of 132.4 and a carbon ratio of 3/9.58 • The approach will be further tested to include current data with with a different size tank, sub- atmospheric pressures, and a spark igniter • Extension using data with a full size tank when available
ACKNOWLEDGMENT • The work was supported by the Fire Safety Division of the FAA William J. Hughes Technical Center, Atlantic City, New Jersey, USA. • Helpful discussions with Richard Hill and Steven Summer of the Fire Safety Division are gratefully acknowledged