Download
1 / 33
340 likes | 350 Views
Vaporization of JP-8 Jet Fuel in a Simulated Aircraft Fuel Tank Under Varying Ambient Conditions. Outline. PART ONE – INTRODUCTION Motivation Review of Literature Objectives of the Thesis PART TWO – EXPERIMENTAL Description of Experimental Setup and procedures

E N D
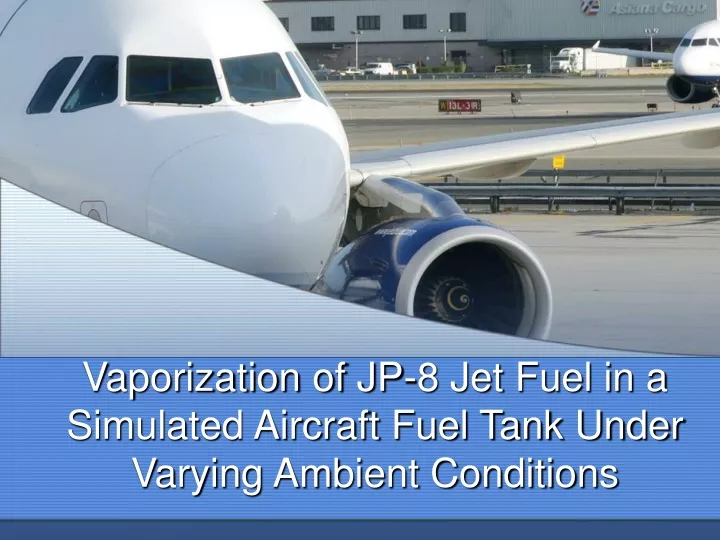
Vaporization of JP-8 Jet Fuel in a Simulated Aircraft Fuel Tank Under Varying Ambient Conditions
Outline PART ONE – INTRODUCTION • Motivation • Review of Literature • Objectives of the Thesis PART TWO – EXPERIMENTAL • Description of Experimental Setup and procedures • Typical fuel vaporization results PART THREE – MODEL CALCULATIONS • Brief Description of Model • Comparison of Calculated and Experimental Data
Introduction • Focus of this work is the study of jet fuel vaporization within a fuel tank • Primary motivation resulted from the TWA Flight 800 disaster in 1996 • NTSB-led accident investigation determined the cause of the crash was an explosion in a nearly empty center wing fuel tank caused by an unconfirmed ignition source
Flammable vapors were said to exist due to the combined effects of bottom surface heating and very low fuel quantity within the tank Low fuel quantity results in different compositions between the liquid and the vapor Lighter low molecular weight components vaporize first These components are known to have a significant effect on vapor flammability Fuel Vaporization Vent Fuel Vapor Liquid Fuel Layer Q Heat Source
Objectives • An experiment was designed to: • Simulate in-flight environment around a fuel tank • Fuel tank situated in an environmental chamber that could simultaneously vary the ambient chamber temperature and pressure • Measure conditions in and around the fuel tank • Fuel tank instrumented with thermocouples • Ullage fuel vapor concentration measured with a flame ionization detector • Comprehensive data sets were generated for model validation • A pre-existing model was used to compare measured and calculated ullage gas temperature and ullage vapor concentration • The same model was used to make flammability assessments and to discuss the flammability in terms of the overall transport processes occurring within the fuel tank
PART TWO: EXPERIMENTAL Apparatus, Procedures, and Results
Facility houses an environmental chamber • designed to simulate the temporal • changes in temperature and pressure • appropriate to an in-flight aircraft • Can simulate altitudes from sea level to 100,000 feet • Can simulate temperatures from -100°F to +250°F • All experimentation performed at the William J. Hughes Technical Center, Atlantic City Int’l Airport, NJ • Aluminum fuel tank placed inside environmental chamber • 36”w x 36” d x 24” h, ¼” Al • 2 access panels on top surface for thermocouple penetration and ullage sampling • 2” diameter vent hole, 3” diameter fuel fill
Test Matrix A quantity of 5 gallons was used for each test An arbitrary fuel temperature setpoint approximately 30°F above the initial temperature was found to create sufficient ullage vapor concentrations within the calibration range Dry tank tests Isooctane (Pure component fuel) Constant ambient pressure Varying ambient temperature and pressure Repeatability Experimental Procedure
Test Procedure:Constant Ambient Pressure at Sea Level For constant sub-atmospheric pressure tests, the ambient pressure was reduced after fuel was loaded, equilibrated at reduced pressure for 1-2 hours • Pump fuel into tank, let sit for 1-2 hours • Collect temperature and hydrocarbon data after this time, check that the change in THC is less than 1,000 ppm / ten minutes • Turn tank floor heater on • Record data • Test complete upon quasi-equilibrium at fuel set point temperature • Export data and use in computer model For varying ambient temperature and pressure tests, after quasi-equilibrium was attained at the fuel set point temperature, the flight profile was initiated and the tank heater was turned off, data was recorded until ten minutes after the flight profile ended
Typical Results: Fuel Tank at Sea Level, Constant Ambient Conditions – Measured Data Liquid, Heater, Ambient Temperatures Uniform liquid temperatures • Similar liquid heating profiles were used for tests of same type • Heating and vaporization trends seen here typical of all other tests • Note the uniformity in the ullage gas temperature (well-mixed) Uniform ullage temperatures Ullage Temperatures Ullage Vapor Concentration Tank Surface Temperatures Top surface cooler than front and right surfaces due to heating from below
Modeling Fuel Vaporization • Modeling can be used to determine the amount of fuel vapor generated in the ullage space at a given moment • Combined with flammability limit correlations, the model can give estimates of the duration of time in which the fuel tank can be considered flammable • The model used in this work (Polymeropoulos 2004) employed the flow field that developed as a consequence of natural convection between the heated tank floor and the unheated ceiling and sidewalls • Vaporization of liquid on the tank floor and condensation of vapor on the unheated walls and ceiling
Physical Considerations • 3D natural convection heat and mass transfer • Liquid vaporization • Vapor condensation • Mass flux through vent • Variable Pa and Ta • Multicomponent vaporization and condensation • Well mixed gas and liquid phases • Raullage~o(109) • Raliquid~o(106)
Principal Assumptions • Well mixed gas and liquid phases • Uniformity of temperatures and species concentrations in the ullage gas and in the evaporating liquid fuel pool • Use of available experimental liquid fuel, and tank wall temperatures • Quasi-steady transport using heat transfer correlations and the analogy between heat and mass transfer for estimating film coefficients for heat and mass transfer • Liquid Jet A composition from published data from samples with similar flash points as those tested (Woodrow 2000)
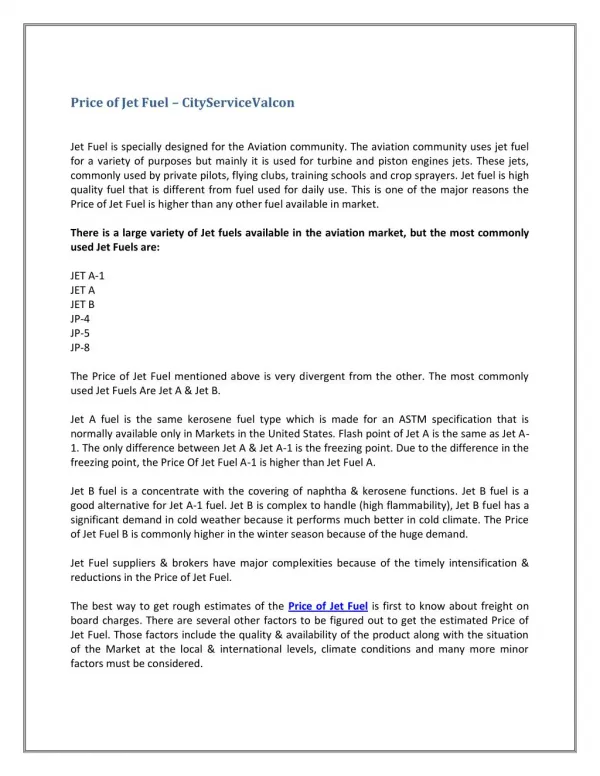
Brief Review of Jet Fuels • ASTM D 1655 is the current standard for Jet-A, Jet –A1, and JP-8 • Regulates maximum and minimum limits for stated properties or measurements • Does not require an exact composition of chemical species, and can consist of hundreds of different components • Analysis has revealed over 300 compounds in a batch of Jet-A, and the composition is about 75-85% paraffin compounds
Characterization of Experimental Fuel • Fuel used in this experimentation was tested twice for flashpoint • Both tests resulted in a fuel flashpoint of 117°F • Characterized fuels from Woodrow (2000) with similar flashpoints were sought to represent the experimental fuel • Compositions of two fuels with flashpoints of 115°F and 120°F were used to essentially “bracket” the experimental fuel with flashpoint of 117°F
Validation of the Well Mixed Assumption Dry tank at 30,000’: Measured Ullage Temperatures • Turbulent Mixing • Model assumes uniform, well-mixed ullage gas from the magnitude of the Raleigh number, based on the floor to ceiling temperature difference and the distance between them, typically of order 109 • This assumption is validated by the experimental data from three ullage thermocouples in various spatial locations within the ullage • One test with no fuel in the tank • One test with fuel in the tank • Similar uniformity in ullage gas temperature was found in all other tests as well Tank at sea level with 5 gal. fuel: Measured Ullage Temperatures
Ullage Gas Temperature Predictions • The data from the same two tests input into the model to calculate the ullage gas temperature • Ullage gas temperature predictions were within the thermocouple measurement error • Ullage gas temperature predictions agree well with measured ullage gas temperature • Similar good agreement was found in all tests
Constant Ambient Pressure at Sea Level • Fuel Tank with Five Gallons of JP-8 • Two fuel compositions (F.P. = 115 and 120 °F) with flashpoints bracketing the experimental fuel’s flashpoint (F.P. = 117°F) were used to calculate the ullage vapor concentrations • Two tests are shown with similar heating profiles, both with 5 gallons of fuel in a tank at sea level • Calculated results were in good agreement with measured data
Constant Reduced Ambient Pressure 10,000 feet • Tests at 10,000 ft., 20,000 ft., and 30,000 ft. • At 30,000 ft. the fuel had to be cooled in order to stay within the calibration range due to increased vapor concentration at altitude 20,000 feet Good agreement was found between calculated and experimental results 30,000 feet
Simulated Flight Conditions10,000 ft. Cruise • Simulated Flight Conditions • One hour of ground time with bottom surface fuel tank heating • Ascend to cruise at 1,000 ft./min. • Cruise for one hour • Descend to ground at -1,000 ft./min. • Standard atmosphere pressure
Simulated Flight Conditions 30,000 ft. Cruise • Good agreement was found between calculated and measured results for varying ambient conditions
Conclusions about Model Results • The model gave accurate estimates of the ullage fuel vapor concentration under constant and varying ambient conditions utilizing two different fuel characterizations • Confidence in the model’s predictions allows us to use the model to: • Describe the transport processes occurring within the system (conservation correlations) • Use pre-existing flammability limit correlations for hydrocarbon fuels to determine the amount of time the system could be considered flammable
Calculated Mass Transport:Fuel tank at sea level Fuel Tank Conditions as a Function of Time • The variation of ullage vapor fuel concentration can be explained by the model’s calculations of temporal mass transport • Mass of fuel evaporated increases as the fuel temperature increases • Mass of fuel condensed increases as the mass of fuel stored in the ullage increases and the wall temperatures approach the dew point temperature for that mixture • The mass of fuel stored is the difference between the mass evaporated and the mass condensed • Very little venting due to constancy of internal and external pressure Mass Flux of Fuel as a Function of Time 1 3 2 4
Fuel Tank Conditions as a Function of Time Calculated Mass Transport:Simulated Flight at 30,000’ • In this case there is significant mass out flux of ullage gas due to the pressure differential between the interior and exterior of the fuel tank • There is also significant condensation on inner tank surfaces due to reduced ambient temperature at altitude Mass Flux of Fuel as a Function of Time
Determination of the LFL • Defines a flammable range at a given pressure • For liquids of known composition, Le Chatelier’s rule can be used to estimate the LFL (Affens and McLaren 1972) • Empirical formula that correlates flammability limits of multi-component hydrocarbon fuels with the flammability limits of the individual components • Accounts for both the concentration and composition of the fuel-air mixture • The mixture is considered flammable if LC>1 • An empirical criterion for estimating the FAR at the LFL states that at the LFL the FAR on a dry air basis is (for most saturated hydrocarbons) (Kuchta 1985) • FAR = 0.035±0.004 at 0°C
Flammability Assessment:Fuel tank at sea level • FAR rule and Le Chatelier’s rule were used to assess the flammability using the model calculations • Fuel compositions with flashpoints bracketing the experimental fuel flashpoint
Flammability Assessment:Simulated Flight at 30,000’ • FAR rule and Le Chatelier’s rule were used to assess the flammability using the model calculations • Fuel compositions with flashpoints bracketing the experimental fuel flashpoint
Effect of Liquid Temperature on Flammability:Fuel tank at sea level Effect of Mass Loading on Flammability: Fuel tank at sea level Increasing the liquid temperature can increase the FAR well into the flammable region Decreasing the mass loading can reduce the FAR to below the flammable region
Effect of Liquid Temperature on Flammability:Simulated Flight 30,000’ Effect of Mass Loading on Flammability: Simulated Flight 30,000’ Increasing the liquid temperature can increase the FAR well into the flammable region Decreasing the mass loading can reduce the FAR to below the flammable region
Conclusions • Experimentation was successful in measuring ullage vapor concentration in a simulated fuel tank exposed to varying ambient conditions • A large data set was generated that can be used for validating fuel vaporization models • The model used in this work proved to be accurate in it’s predictions of ullage gas temperature and ullage gas vapor concentration • The model was useful in describing the transport processes occurring within the tank and explaining the ullage vapor concentration with a mass balance • The model was useful in estimating the level of mixture flammability in the ullage utilizing both FAR and Le Chatelier’s criterion for the lower flammability limit