Download
1 / 45
450 likes | 729 Views
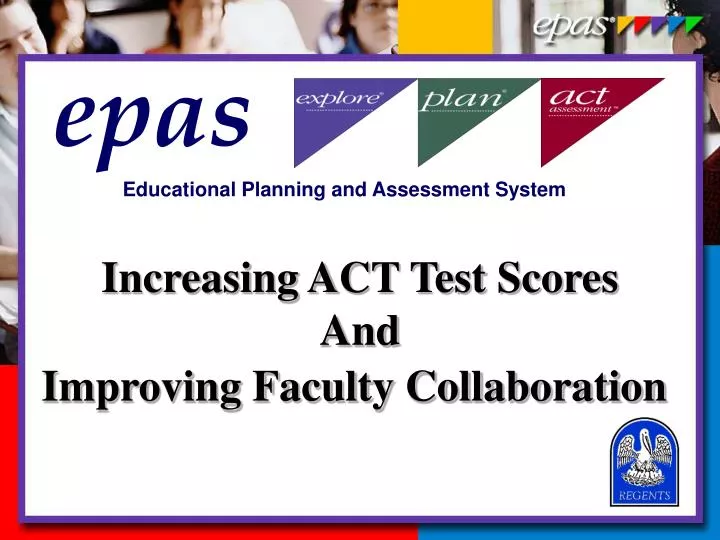
epas. Educational Planning and Assessment System. Increasing ACT Test Scores And Improving Faculty Collaboration. E. P. A. S. Lake Providence Sr. High School. Mrs. Rosie Armstrong, Principal EPAS Team Members Mr. Solomon Armstrong Ms Rochelle Kelley Ms. Diane Turner .

E N D
epas Educational Planning and Assessment System Increasing ACT Test Scores And Improving Faculty Collaboration
E. P. A. S.Lake Providence Sr. High School Mrs. Rosie Armstrong, Principal EPAS Team Members Mr. Solomon Armstrong Ms Rochelle Kelley Ms. Diane Turner
If you are hungry and I give you a fish, I’ve only fed you for today. If I show you how to fish, then you can eat for a lifetime.
If I could offer you a plan to help raise GEE 21 / ACT scores in your content area, would you buy this plan?
If I could offer you a plan to help your students take ownership for their success , would you buy this plan?
EXPLORE the possibilities for career and academic development. PLAN for academic success. ACT as the village/the team/the family to support our children as they achieve their goals. SUCCESS is knocking at the door. For a minimal cost, the CC, you can be a member of a winning team.
E P A S Educational Planning and Assessment System Is the answer!!!!
Why Use EPAS? Lake Providence/East Carroll Parish has the unfortunate title of being the “poorest place in America.” It must be so because it has appeared in several syndicated papers. We saw the pictures – we read the story! Here’s $5.25. That’s minimum wage. Most of our students will leave school to earn $5.25 at Sonic, Jong’s, Family Dollar, Pizza Hut, or Subway. $5.25 will not get our students and our town out of poverty. We must get more of our students in college and in our technical schools or the statistics will continue to look like this:
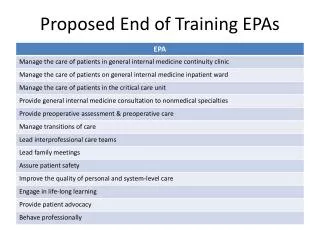
For Every 100 9th Graders • 56 will graduate high school • 33 will go to college immediately after high school • 22 will persist to their sophomore year • 12 will graduate within 6 years
Louisiana Public Postsecondary Education Board of Regents LSU System LSU - BR UNO LSU - Shreveport LSU - Alexandria LSU - Eunice LSU - Law Center LSU - Ag. Center LSU - Health Sciences Center Pennington Univ. of LA System Grambling La Tech McNeese Nicholls Northwestern Southeastern U of L - Lafayette U of L - Monroe Southern U. System SU - Baton Rouge SU - New Orleans SU – Shreveport SU- Ag. Center SU- Law Center LA Community & Technical College System Baton Rouge CC Bossier Parish CC Delgado CC Nunez CC River Parishes CC South LA CC Sowella TCC Fletcher TCC LA Delta CC LA Tech College (40 Campuses) Proprietary Schools LUMCON
Board of Regents • Governing and Coordinating Board • Speaks for and exercises budget responsibility for all postsecondary education • Approves all degree programs • Establishes regions to maximize resources • Formulates and revises Master Plan
Master Plan For Postsecondary Education Goal I: Increase Opportunities for Student Access & Success Goal II: Ensure Quality and Accountability Goal III: Enhance Service to Community & State
Admissions Criteria Framework(Effective Fall 2005) Variables: • Successful completion of Regents (TOPS) high school core curriculum • Grade point average (GPA) • ACT composite score • High school graduation rank
Minimum Admissions Standards for LSUS, McNeese, Nicholls, Northwestern, SLU, SU-BR, ULM by 2005* • Completion of Regents (TOPS) High School Core • And one of the following: • High School GPA > 2.0 or • ACT Composite > 20 or • High School Rank (Top 50%) (*LSU-A by 2007, Grambling & SUNO by 2010)
Minimum Admissions Standards for UNO, LaTech and ULL by 2005 • Completion of Regents (TOPS) High School Core • And one of the following: • High School GPA > 2.5* or • ACT Composite > 23 or • High School Rank (Top 25%) * No students admitted with less than a 2.0 GPA.
Minimum Admissions Standards for LSU A&M by 2005 • Completion of Regents (TOPS) High School Core • And one of the following: • High School GPA > 3.0* or • ACT Composite > 25 or • High School Rank (Top 10%) * No students admitted with less than a 2.0 GPA.
Open AdmissionsCommunity and Technical College Campuses • Community Colleges: Baton Rouge, Bossier Parish, Delgado, Delta, Nunez, River Parishes, South Louisiana • Southern University-Shreveport and LSU-Eunice • Louisiana Technical College
Louisiana’s Projected Decline in High School graduates • 2000-2001 46,689 • 2005-2006 43,989 (-5.7%) • 2011-2012 40,984 (-12.2%)
New Jobs in the Workforce Require Greater Education and Skills • 70% of the 30 fastest-growing jobs will require an education beyond high school. • 40% of all new jobs will require at least an associate’s degree. • Total college-level job openings between 1990-2008 will nearly equal number of college educated entrants to the workforce. Source: US Department of Labor, Bureau of Labor Statistics, The Outlook for College Graduates, 1998-2008, 2000, in Getting Ready Pays Off!, US DOE, October 2000, and BLS, Occupational Employment Projections to 2008, in NAB, Workforce Economics, vol.6, Issue 1, Spring 2000.
Louisiana EPAS (Educational Planning and Assessment System) utilizes three programs: EXPLORE - Grade 8 PLAN - Grade 10 ACT - Grades 11 & 12
Louisiana EPAS Purposes: • Raise academic standards, expand college access and success for all students consistent with the Master Plan. • Improve student preparation for important transitions. • Foster effective school improvement programs. • Improve articulation between secondary and postsecondary education/training.
EPAS Instructional Support • Standards for Transition • Descriptions of what students are likely to know and able to do • Pathways for Transition • Learning activities that will help move students to a higher level of performance Both connected to Louisiana Standards
Louisiana EPAS Components • Assessment • Student Planning • Instructional Support • Evaluation
Louisiana EPAS Participants 2004 - 2005 Number EXPLORE 8th Graders 44,230 PLAN 10th Graders 36,639 ACT 12th Graders 25,823 Representing every public school system
“Highlights” • 10th grade performance is at the national average and at an all-time high for Louisiana. • The Louisiana Composite growth for the student cohort taking EXPLORE in 2002 and PLAN in 2004 was 33% greater than the national average .
“Highlights” • African-American/Black students are showing the greatest achievement growth, although at a lower level than the State average. • By any standard of college-readiness, the percent of PLAN and ACT students reaching that standard is increasing.
EPAS Standards for Transition Score Ranges 13–15 16–19 20–23 24–27* 28–32 33–36 EXPLORE PLAN ACT Assessment * Highest score range for EXPLORE is 24–25.
Louisiana EPAS 2004-2005PLAN10th Graders *The Louisiana Composite score growth for the student cohort taking EXPLORE in 2002 and PLAN 2004 was 2.4 points. The national average growth was 1.8 points. *The African-American/Black average Composite score growth has exceeded the Caucasian population by .4 since 2001. *PLAN scores for EPAS participants in 2004-2005 are at an all-time high and the Composite score is at the national average.
Louisiana EPAS PLAN Results 79% of the public school EPAS-tested students state that they plan to go to college or technical school, yet - only 41% have taken or are currently taking Algebra 1 and Geometry, and - only 11% have taken or are taking Algebra 1, Geometry and Algebra 2. -54% are planning to take college preparatory core coursework.* * College core coursework includes four or more years of English and three or more years each of math, social studies and natural science.
Class of 2004 ACT Composite Scores CoreNon-Core English 20.9 16.8 Math 19.9 17.1 Reading 20.6 17.4 Science 20.4 17.7 Composite 20.6 17.4
Louisiana EPAS Results • 10th graders already meeting or exceeding ACT requirements for TOPS:
Percentage of 2004 Louisiana ACT-Tested Public School Graduates Meeting Louisiana’s Admission Standards for Fall 2005, Using ACT Composite Scores Percent While demonstrating faster growth, African-American/Black students continue to lag behind their Caucasian counterparts.
EXPLORE and PLAN National College Readiness Benchmarks The National EXPLORE and PLAN college readiness benchmarks are based on the ACT Assessment college readiness benchmarks. They reflect students’ expected growth from EXPLORE to PLAN to the ACT Assessment and assume sustained academic effort throughout high school. College Readiness Benchmarks EXPLORE PLAN ACT College Course College English Composition 13 15 18 College Algebra 17 19 22 College Biology 20 21 24
English Composition Percentages of 2004-2005 Louisiana EPAS EXPLORE-Tested Students On-Target to be Ready for College-Level Work by High School Graduation Percent ACT Benchmark = 13 ACT Benchmark = 15 ACT Benchmark = 18
College Algebra Percentages of 2004-2005 Louisiana EPAS PLAN-Tested Students On-Target to be Ready for College-Level Work by High School Graduation Percent ACT Benchmark = 17 ACT Benchmark = 19 ACT Benchmark = 21
College Biology Percentages of 2004 Louisiana ACT-Tested Graduates Ready for College-Level Work Percent ACT Benchmark = 20 ACT Benchmark = 21 ACT Benchmark = 24
EXPLORE and PLAN Louisiana Developmental Benchmarks The EXPLORE and PLAN Louisiana College Developmental benchmarks are based on the ACT scores required by Louisiana for entry into freshman college-level credit-bearing English and Mathematics courses. They reflect students’ expected growth from EXPLORE to PLAN to the ACT and assume sustained academic effect throughout high school. College Readiness Benchmarks EXPLORE PLAN ACT College Course English 13 15 18 Mathematics 14 16 18
English Percentages of Louisiana Students On-Target to be Ready for College-Level Work as Defined by Louisiana in English Percent Louisiana Benchmark = 13 Louisiana Benchmark = 15 Louisiana Benchmark = 18
Mathematics Percentages of Louisiana Students On-Target to be Ready for College-Level Work as Defined by Louisiana in Mathematics Percent Louisiana Benchmark = 14 Louisiana Benchmark = 16 Louisiana Benchmark = 18
MATHEMATICS: Readiness for College Algebra Figure 2.5: Average ACT Mathematics Test Score Increase by High School Mathematics Course Sequence for All Louisiana Students Average ACT Mathematics Score Increase from Alg I, II, Geom Average ACT Mathematics Score % Taking Course Sequence Algebra I, II, Geom, Trig, Calculus 4% 23.5 Average Score Increase 6.6 Algebra I, II, Geom, Trig, Other Advanced Math 4% 21.1 Average Score Increase 4.2 Other Combinations, 4 or More Years 21.8 26% Average Score Increase 4.9 Algebra I, II, Geom, Other Advanced Math 19.1 16% Average Score Increase 2.2 23% Algebra I, II, Geom 16.9 Louisiana students taking at least one course beyond Algebra I, II, and Geometry on average score significantly higher on the ACT Mathematics Test than students taking Algebra I, II, Geometry and no more.
SCIENCE: Readiness for College Biology Figure 2.8: Average ACT Science Test Score Increase by High School Science Course Sequence for All Louisiana Students Average ACT Science Score Increase from Less Than 3 Years of Science Average ACT Science Score % Taking Course Sequence General Science, Biology, Chemistry, Physics 45% 21.3 Average Score Increase 4.5 Biology, Chemistry, Physics 2% 22.9 Average Score Increase 6.1 General Science, Biology, Chemistry 18.5 35% Average Score Increase 1.7 Less than 3 Years of Science 16.8 11% Louisiana students taking Physics on average score significantly higher on the ACT Science Test than students taking less than 3 years of science or no Physics.
Getting Every Louisiana Student Ready for College and Work 1. How do we reinforce the need for high school students to take the Regents’ core? 2. How do we communicate the need for students to take the most rigorous courses within the Regents’ core? 3. How do we communicate the need for students to take the most rigorous courses beyond the Regents’ core? 4. How do we ensure that academic courses are sufficiently rigorous?
Contact Information ACT Staff (512) 345-1949 Glen Gullikson Director, School and Career Services Judy Trice Consultant School Services judy.trice@act.org Karen Pennell Director, Postsecondary and Workforce Services Board of Regents Staff (225) 342-4253 Heather Spillers Devall, EPAS Coordinator Assistant Commissioner for Assessment and Economic Dev. hdevall@regents.state.la.us Kelly Papania, Postsecondary Planning Specialist kpapania@regents.state.la.us