Download
1 / 52
520 likes | 668 Views
ACT EPAS. Beth Cipoletti, Ed.D. Office of Student Assessment Services. ACT EPAS. E ducational P lanning and A ssessment S ystem. EXPLORE, PLAN, and the ACT.

E N D
ACT EPAS Beth Cipoletti, Ed.D. Office of Student Assessment Services
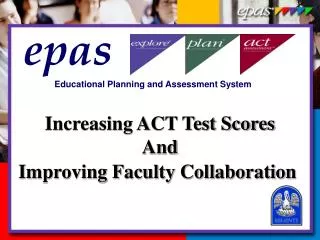
ACT EPAS Educational Planning and Assessment System
EXPLORE, PLAN, and the ACT • Measures students’ progressive development of knowledge and complex skills important for later education and careers in the same academic areas from grades 8 through 12 • English • Mathematics • Reading • Science
EXPLORE, PLAN and the ACT Additional Components • UNIACT Interest Inventory – helps students explore relevant career options • Needs Assessment – collects information about students’ perceived needs • Plans and Background Information – gathers information about coursework plans and education career plans after high school
Interest Inventory • List has 72 activities for EXPLORE and PLAN • List has 90 activities for the ACT • Students response • I would dislike doing this activity (D) • I am indifferent (don’t care one way or the other) (I) • I would like doing this activity (L)
Needs Assessment • Exploring options/making plans for education, career, and work after high school • Improving writing skills • Improving reading speed for comprehension • Improving study skills • Improving mathematical skills • Improving computer skills • Improving public speaking skills • Improving personal skills
EXPLORE Eighth Grade
PLAN Tenth Grade
2006 West Virginia High School Graduates • 11% reported taking less than 3 years of math; 9% of these were college ready • 26% reported taking the minimum ACT core (Algebra I, Algebra II, and Geometry); 6% of these students were college ready • 46% of the students who took math courses beyond the minimum core were college ready
2006 West Virginia ACT Student Score Ranges • 60% of the English scores were 20 or above • 42% of the mathematics scores were 20 or above • 59% of the reading scores were 20 or above • 58% of the science scores were 20 or above
PLANCompositeScore Range PLANCompositeScore Range EXPLORE Score EXPLOREScore Estimated PLAN Composite Score Ranges for EXPLORE Composite Scores 1–3 4–8 9-10 11-12 13 14 15 16 17 8–11 10-13 11-14 12-15 13-16 14-17 15-18 16-19 17-20 18 19 20 21 22 23 24 25 17-21 19-23 20-24 21-25 22-26 23-27 24-28 25-29 PLAN Predicted Score Ranges
ACT AssessmentCompositeScore Range ACT AssessmentCompositeScore Range PLANScore PLANScore Estimated ACT Assessment Composite Score Ranges for PLAN Composite Scores 1–3 4–6 7–8 9–10 11–12 13 14 15 16 17–18 19 8–10 9–11 10–12 11–14 12–15 12–16 13–17 15–19 17–21 18–22 19–23 20 21 22 23 24 25 26 27 28 29–30 31–32 21–25 22–26 23–27 24–28 25–29 27–30 28–31 29–32 30–33 31–34 32–35 ACT Predicted Score Ranges
ACT College Readiness Benchmarks Through collaborative research with postsecondary institutions nationwide, ACT has established the following college readiness benchmarks: • College English Composition: 18 on ACT English Test • College Algebra: 22 on ACT Mathematics Test • Social Sciences: 21 on ACT Reading • College Biology: 24 on ACT Science Test A benchmark score is the minimum score needed on an ACT subject-area test to indicate a 50% chance of obtaining a B or higher or about a 75% chance of obtaining a C or higher in the corresponding credit-bearing college course.
ACT Core Curriculum • English (four years or more): English 9, English 10, English 11, and English 12 • Mathematics (three years or more): Algebra I, Algebra II, and Geometry • Social science (three years or more): US History, World History, and American Government/Civics • Natural Science (three years or more): General Science (General, Physical, and Earth), Biology, and Chemistry
EXPLORE Results forStudent “A” English 15 Mathematics 14 Reading 19 Science 17
Predicted PLAN Scoresfor Student “A” English ____ Mathematics ____ Reading ____ Science ____
Predicted ACT Scores for Student “A” English ____ Mathematics ____ Reading ____ Science ____
Pair and Share • What would you tell Student “A”about the EXPLORE results? • How would you use the predicted PLAN and ACT scores? • What would you tell the Student “A’s” parents about the EXPLORE scores and predicted PLAN and ACT scores?
Student “A” Reported Needs • Making plans for my education, career, and work after high school • Improving my computer skills • Improving my public speaking skills
Student “A” Course Plans • 3 years of English • 2 years of mathematics • 3 years of social studies • 3 years of science
Student “A” Educational and Career Area Preference • 4-year college or university • Medical Diagnosis & Treatment • Physician, Pathologist, Dentist, Veterinarian, Nurse Anesthetist
Pair and Share • What would you tell Student “A” about the identified needs, educational and course plans, and career area preference? • How would you use the predicted PLAN and ACT scores to advise Student “A” when scheduling courses? • What would you tell the Student “A’s” parents about his/her identified needs and course plans?
EXPLORE2005-2006 Students Likely to be Ready for College-Level Work
PLAN2005-2006 Students Likely to be Ready for College-Level Work
ACT-Tested2005-2006 Students Likely to be Ready for College-Level Work
Performance of WV High School Graduates Enrolled in Public Colleges and Universities West Virginia Higher Education Policy Commission, August 2005
Performance of WV High School Graduates Enrolled in Public Colleges and Universities West Virginia Higher Education Policy Commission, August 2005
“Nearly 45% of students who declare an intention to go to college after high school have not taken the college-preparatory courses that will allow them to proceed to credit-bearing courses (ACT, On Course for Success, 2004, p. 2).”
“Those who take two or more remedial courses are unlikely to graduate, even after six years of college; half of those who take only one remedial math course are unlikely to persist to the degree”(ACT, On Course for Success, 2004, p. 3).
“In 2003, the average full time year-round worker in the United States with a four-year college degree earned $49,900, 62% more than the $30,800 earned by the average full-time year-round worker with only a high school diploma” (Baum & Payea, 2005, p. 10).
“The typical bachelor’s degree recipient can expect to earn about 73% more over a 40-year working life than the typical high school graduate earns over the same time period” (Baum & Payea, 2005, p. 11).
The Toolbox Revisited: Paths to Degree Completion from High School through College “The world has done quantitative: business, geography, criminal justice, history, allied health fields – a full range of disciplines and job tasks tells students why math requirements are not just some abstract school exercise” (Adelman, 2006, p. 3).
Toolbox Revisited “By the end of the second calendar year of enrollment, the gap in credit generation in college-level mathematics between those who eventually earned bachelor’s degrees and those who didn’t is 71 to 38 percent…The math gap is something we definitely have to fix” (Adelman, 2006, p. 3).
Student Misperceptions about College Preparation • “Meeting high school graduation requirements will prepare me for college.” • “It’s better to take easier classes in high school and get better grades.” • “I don’t have to worry about my grades, or the kind of classes I take, until my sophomore year.” • “Community colleges don’t have academic standards.” (Venezia, Kirst, & Antonio, 2006)
College Readiness Begins in Middle School • Conducted by ACT • Involved 2,942 eighth and tenth grade students • Included students from 15 schools in 6 districts (Chicago; Charleston, West Virginia; Denver; Los Angeles; New Orleans; and Oklahoma City) (Wimberly & Noeth, 2005)
Middle and Early High School Student Planning for Post-Graduation • 22% had not thought about what types of education, training or work they might pursue after graduation • 70% of the students’ families had started exploring how to pay for college or training • 77% plan to attend a 4-year college or university • 60% report taking college preparatory courses • 66% of the tenth graders reported their high school counselor helped them select their high school courses (Wimberly & Noeth, 2005, 9-11)