Download
1 / 22
220 likes | 225 Views
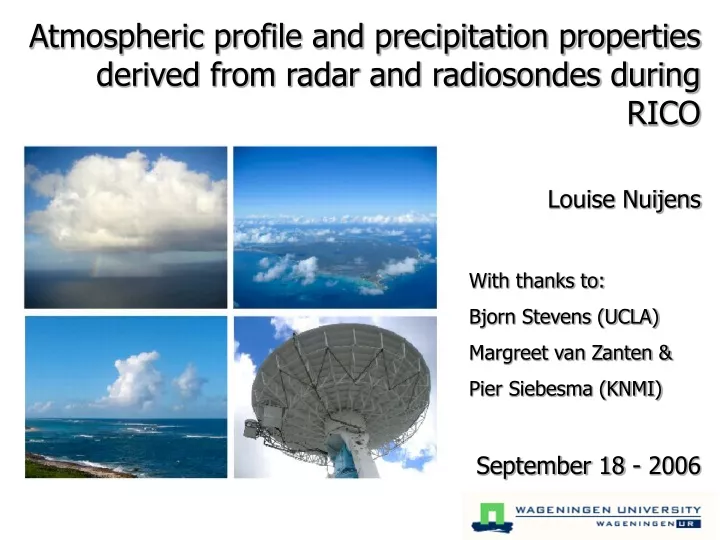
Atmospheric profile and precipitation properties derived from radar and radiosondes during RICO. Louise Nuijens With thanks to: Bjorn Stevens (UCLA) Margreet van Zanten & Pier Siebesma (KNMI) September 18 - 2006. In this talk. Analysis of S-Pol radar data

E N D
Atmospheric profile and precipitation properties derived from radar and radiosondes during RICO Louise Nuijens With thanks to: Bjorn Stevens (UCLA) Margreet van Zanten & Pier Siebesma (KNMI) September 18 - 2006
In this talk Analysis of S-Pol radar data How frequent and with what intensity do trade wind cumuli produce rain? from a large scale perspective Analysis of sounding data Can we relate this rainfall to the vertical (dynamic) structure of the atmosphere? Can we provide statistics for modeling studies?
100 km 20 km > 10 dBZ Raw Filtered Radar analysis: S-Pol • S-Band horizontal (surveillance) scans • Time resolution: ~ 70 scans a day a scan each 20 minutes • Filtering of ground / sea clutter, birds and Bragg scatter (10 dBZ threshold) • Z-R relation: Uijlenhoet, 2004 1 mm/h 24 dBZ
z ~ 500 m The radar observes rain below cloud base (~ 600 m) 20 km - 60 km Data selection based on range attenuation
Area rainfall during RICO: Time series and probability of rainfall
Time series of area rainfall Mean rainrate 0.026 mm/h ~ 18 W/m2 many small rain peaks “trade cu period” Mean echo coverage: 1.7 %
Rainfall probability How much do the small peaks contribute to the total rainfall? 50 % 0.125 mm/h
Coverage = 2.55 % Recho = 2.12 mm/h Coverage = 1.41 % Recho = 1.52 mm/h Echo cells (3 km) Rainband (> 20 km) Dec 22, 05 UTC Dec 29, 01 UTC Echo structure and rain rates
Can we relate the relative amount of rainfall to the atmospheric profiles ?
Sounding analysis Three type of soundings: • Spanish Point on Barbuda • R/V Seward Johnson • C-130 dropsondes
NE radar domain q SST
Dec 13, 14, 15 Jan 9, 13, 14, 18 Sounding analysis Do soundings relate to small rain events? • Relate each sounding to a 6 hour average area rainrate • Group by following rainrates in mm/h : 1. 0 – 0.002 ~ 1.4 Wm-2 2. 0.002 – 0.02 ~15 Wm-2 3. > 0.02 NE
0 - 0.002 0.002 - 0.02 >0.02 Vertical profiles Specific humidity 1.5 g/kg
Vertical profiles Temperature
Vertical profiles Relative humidity 15-20 %
Rainfall versus cloud depth Estimating cloud depth for each sounding Using a very simple parcel ascent scheme for a diluting air parcel: • Air parcel released from max v in the lower subcloud layer • Giving small release excesses l and qt • With entrainment rate inversely proportional to height of parcel Cloud base = LCL, cloud top LZB (v, parcel = v)
Some last thoughts… • How do the LES simulations and profiles compare to these findings? • Difficult to obtain a close correlation between parameters derived from soundings and the area rainfall • water vapor deficiency? • theta gradient in cloud layer? • …?
Comparison to other estimates Area rain rate [mm/h] S-Pol rain rate coincides with relative rain ratefromsurface station. Suggests that rain reaches the surface.