Download
1 / 14

E N D
TOP-DOWN ISOPRENE EMISSION INVENTORY FOR NORTH AMERICA CONSTRUCTED FROM SATELLITE MEASUREMENTS OF FORMALDEHYDE COLUMNSDaniel J. Jacob, Paul I. Palmer, Dorian S. Abbot, May FuAtmospheric Chemistry Modeling Group, Harvard UniversityRandall V. MartinDalhousie UniversityKelly V. ChanceHarvard/Smithsonian Center for Astrophysics
MEASUREMENT OF HCHO COLUMNS FROM THE GOME SATELLITE INSTRUMENT • HCHO column is determined from backscattered solar radiance in 340 nm absorption band • Instrument is in polar sun-synchronous orbit, 10:30 a.m. observation time • 320x40 km2 field of view, three cross-track scenes • Complete global coverage in 3 days • Operational since 1995
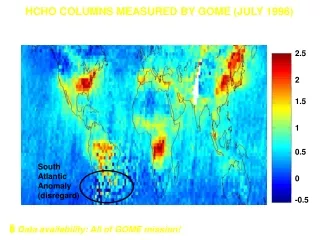
HCHO COLUMNS MEASURED BY GOME (JULY 1996) 2.5x10¹⁶ molecules cm-2 2 1.5 detection limit 1 0.5 South Atlantic Anomaly (disregard) 0 -0.5 High HCHO regions reflect VOC emissions from fires, biosphere, human activity
GOME HCHO COLUMNS OVER NORTH AMERICA July 1996 means …compare to GEOS-CHEM global atmospheric chemistry model simulation including GEIA biogenic VOC emissions [Guenther et al., 1995] and EPA anthropogenic VOC emissions GEOS-CHEM vs. GOME: R = 0.83, bias = +14% GOME GEOS-CHEM model
RELATING HCHO COLUMNS TO VOC EMISSION hn (340 nm), OH oxn. VOCi HCHO yield yi k ~ 0.5 h-1 Emission Ei smearing, displacement In absence of horizontal wind, mass balance for HCHO column WHCHO: Local linear relationship between HCHO and E … but wind smears this local relationship between WHCHO and Ei depending on the lifetime of the parent VOC with respect to HCHO production: Isoprene WHCHO a-pinene propane Distance downwind 100 km VOC source
HCHO COLUMN vs. ISOPRENE EMISSION RELATIONSHIPIN GEOS-CHEM MODEL Results for U.S. quadrants in July 1996 simulation w/ 2ox2.5o horizontal resolution show: (1) dominance of isoprene emission as predictor of WHCHO variability; (2) linear relationship between the two Standard simulation NW NE HCHO from simulation w/o Isoprene emission Model HCHO column [1016 molec cm-2] SW SE We use this relationship to derive “top-down” isoprene emissions from the GOME HCHO column observations Isoprene emission [1013 atomC cm-2 s-1]
ISOPRENE EMISSION INVENTORIES, JULY1996 GOME top-down (5.7 Tg) GEIA (7.1 Tg) BEIS2 (2.6 Tg)
Mean daytime HCHO observations Jun-Aug 1988-1998 MODEL vs. OBSERVED SURFACE HCHO GEOS-CHEM simulation with “GOME” isoprene emissions high outliers GOME isoprene emission inventory gives better fit to surface HCHO data than either GEIA or BEIS2
OZARKS “ISOPRENE VOLCANO” AS SEEN BY GOME Temperature dependence of isoprene emission (GEIA) GOME HCHO columns over the Ozarks, July 1996: daily orbits and relationship to temperature
SEASONALITY OF GOME HCHO COLUMNS (9/96-8/97)Largely reflects seasonality of isoprene emissions;general consistency with GEIA but also some notable differences GOME GEOS-CHEM (GEIA) GOME GEOS-CHEM (GEIA) MAR JUL APR AUG SEP MAY JUN OCT
INTERANNUAL VARIABILITY OF GOME HCHO COLUMNS Augusts 1995-2001: correlation with temperature anomaly explains some but not all of the HCHO column variability GOME HCHO Temp. anomaly GOME HCHO Temp. anomaly 1995 1999 1996 2000 2001 1997 1998
WHAT NEXT? Retrieve HCHO columns from SCIAMACHY solar backscatter instrument on board Envisat (launched 3/2002): 30x60 km2 field of view Increase resolution of GEOS-CHEM model, use a regional model (CMAQ), account for smearing, quantify errors Implement new-generation MEGAN isoprene emission inventory from A.B. Guenther Optimize VOC emission estimates by blending of bottom-up and top-down information
ALSO NEED TO LOOK AT OTHER CONTINENTS!…what is going on over Hanoi in spring?
TO KNOW MORE: • Abbot, D. S., P. I. Palmer, R. V. Martin, K. V. Chance, D. J. Jacob, and A. Guenther, Seasonal and interannual variability of isoprene emissions as determined by formaldehyde column measurements from space, Geophys. Res. Lett., in press. • Palmer, P. I. D.J. Jacob, A. M. Fiore, R. V. Martin, K. Chance, and T. Kurosu, Mapping isoprene emissions over North America using formaldehyde column observations from space, J. Geophys. Res., 108, 4180, doi:10.1029/2002JD002153, 2003. • Palmer, P. I., D. J. Jacob, K. Chance, R. V. Martin, R. J. D, Spurr, T. P. Kurosu, I. Bey, R. Yantosca, A. Fiore, and Q. Li. Air mass factor formulation for spectroscopic measurements from satellites: application to formaldehyde retrievals from GOME, J. Geophys. Res., 106, 14,539-14,550, 2001. • Chance K., P. Palmer, R.J.D. Spurr, R.V. Martin, T. Kurosu, and D.J. Jacob. Satellite observations of formaldehyde over North America from GOME, Geophys. Res. Lett., 27, 3461-3464, 2000.