Download
1 / 21
210 likes | 320 Views
Field Measurement Networks. D. Hollinger, E. LaPoint, R. Birdsey, L. Heath U.S. North American Carbon Program (NACP) Investigators Meeting, January 22-24, 2007.

E N D
Field Measurement Networks D. Hollinger, E. LaPoint, R. Birdsey, L. Heath U.S. North American Carbon Program (NACP) Investigators Meeting, January 22-24, 2007
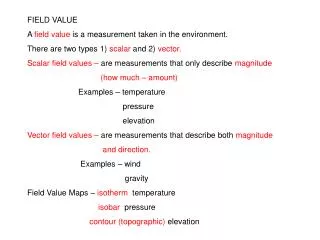
Diagnosis – Where are the C sources & sinks across N. America?Attribution – What are the mechanisms responsible?Prediction – How will these change in the future? Field measurements provide: • C stocks, fluxes, uncertainties • Other fluxes • Mechanistic understanding • Environmental data • Tair, PAR, ppt, RH, Tsoil, soil moisture, net radiation components, etc.
Use of Field Measurement Network data: • Independent estimate of spatial pattern of C sources & sinks • Primary data source for developing & testing models • Source of environmental data for models • Inverse analyses: • Model parameter estimation (Remote sensing & biogeochem) • Constraints on model states (C flux from atmospheric model) • Data assimilation
Desired characteristics of NACP field data: • Relevance • Coverage • spatial, temporal • Quality • good & better • Uniformity of approach • Accessibility • On line?
FIA plots Landscape level plots Experimental Forests LTER AmeriFlux, Fluxnet Canada NEON Yield maps County statistics Agricultural Experiment Stations AmeriFlux, AgriFlux Field Measurement Networks Relevant to the NACP (C flux or Dstocks) Non-agricultural sites Agricultural sites Intensive Extensive
Five-Year Panel: Year One Year Two Year Three Year Four Year Five USDA Forest Service FIA Plots a gift to the NACP • 6000 acre grid cells • 1 plot per grid cell • >800K plots • each plot visited every 5 (east) or 10 (west) years
Sample-Location Variables Location ID: St, Un, Co, # Date: Mo, Day, Yr Sample Kind: Remeas. 1/5th GPS: Lat-Long. Tree Variables Species: Yellow Poplar DBH: 12.9 inches Tree history: Live Tree Class: Growing Stock Condition Variables Slope & Aspect: Pct & Degrees Land Use: Forest Stand Origin: Natural Owner Class: Individual Condition A = Mature Stand Old 1/5-acre plot Condition B = Seedling-Sapling Stand FIA Plot Measurements 1 plot/6,000 acres
Species, dbh 46 states already in annual inventory Federal land included All plots geo-located, corrupted coordinates available to public Soil & litter data (including C) Coarse woody debris Crown measures FIA Plots “P3” Plots(1/96,000 acres) Standard Plots(1/6,000 acres)
FIA Data Available from National Spatial Data Services Team Website http://www.fs.fed.us/ne/fia/spatial/index_ss.html Questions, contact Liz LaPoint: elapoint@fs.fed.us
The next step - FIA data-based forest carbon estimates (Linda Heath)COLE: Carbon On Line Estimation web tool • Mensuration-based conversion of diameters to C mass • also soil & CWD C • County basis • carbon estimates soon to be on FIA website http://ncasi.uml.edu/COLE
Landscape scale Monitoring Sites – the missing tier (Birdsey & Law) • Designed to interface with remote sensing & inventory measurements • 3 x 3 km grid of inventory plots surrounding a special research installation • Flux, meteorological tower or other installation at center • Inventory plots follow FIA protocol • Other measures (litterfall, respiration) take place at inventory plots • Central km2 has intensive biometric measurements • Larger area for Lidar; will include range of disturbance Niwot Ridge LTER, Colorado
Forest Inventory and Analysis plots: • Uniform coverage in continental US of all land classes • But not measured in non-forested land (e.g. agriculture) • Mostly uniform approach • QC/QA • Central data source & service team Relevance: 9 Coverage: 8 Quality: 10 Uniformity: 9 Accessibility: 10
Landscape level plots: • Implementation tested at 6 sites • Fluxes and stocks • Designed to address NACP questions • Field manual • No funding source • MEETING TONIGHT! Relevance: 10 Coverage: 3 (sparse) Quality: 10 Uniformity: 9 Accessibility: 6
Experimental Forests: • 59 sites • Lugo et al. BioScience 2006, Adams et al. GTR NE-321 • Some with >70 years of inventory data • Ecological, meteorological & streamflow data • Experimental manipulations • Often in hilly terrain Relevance: 7 Coverage: 5 (sparse, forests only) Quality: 8 Uniformity: 5 Accessibility: 3
AmeriFlux, Fluxnet Canada, AgriFlux: Data ? • 82 towers on 53 sites (63 active towers, 41 active with CDIAC data), 22 FCRN • 380 tower-years AmeriFlux, 110 FCRN, AgriFlux • 39 sites >5 years & still active; 10 sites >9 years • CO2 & energy fluxes, environmental & ecological data • New level-4 data products • QC, gap-filling & partitioning Relevance: 9 Coverage: 7 (sparse) Quality: 8 (? sites) Uniformity: 8 Accessibility: 8
NSF LTER Network: • 29 Sites, 21 continental NA • Multi-year NPP & biomass data (Knapp & Smith, 2001) • Streamflow, environmental, & nutrient data • Experimental manipulations • Mechanistic studies Relevance: 8 Coverage: 6 (sparse) Quality: 8 Uniformity: 7 Accessibility: 4
NEON: • 29 Domaines • “Core” and “gradient” sites • CO2 & energy fluxes, detailed environmental & ecological data • Experimental manipulations • Cyberinfrastructure Relevance: 8 (wildland only) Coverage: 8 (hierarchical) Quality: 9 Uniformity: 10 Accessibility: 10
Regional FIA Plot Network & Flux towers 120 Forest Plots, 3 towers Birdsey, Hom, Clark, Pan, & Potter
Summary • FIA plots • Excellent coverage & data accessibility • Landscape level plots • Great idea, incorporate into NEON? • Experimental Forests • AmeriFlux, Fluxnet Canada, AgriFlux • Extensive NA coverage, good data accessibility • LTER sites • NEON