Download

1 / 22
220 likes | 407 Views
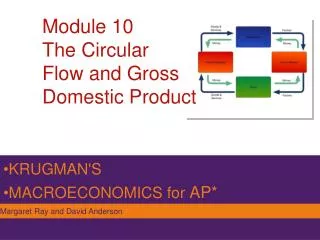
Circular Flow and Gross Domestic Product. Objective:. What is the circular flow diagram of the economy? What is GDP and how do you calculate it?. Circular-Flow Diagram.

E N D
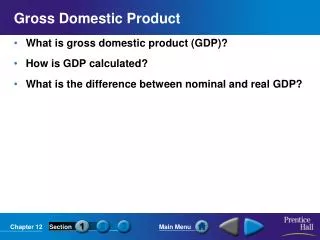
Objective: • What is the circular flow diagram of the economy? • What is GDP and how do you calculate it?
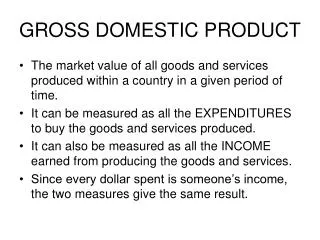
Circular-Flow Diagram • All countries calculate a set of numbers known as the national income and product accounts. The more reliable the accounts, the more economically advanced the country is. • Bureau of Economic Analysis, a division of the Department of Commerce, calculates the national accounts (national income and product accounts) to keep track of spending of consumers, sales of producers, business investment spending, government purchases, and many other flows of money amount different sectors of the economy.
Circular-Flow Diagram • The circular-flow diagram is a simplified representation of the macroeconomy. • Shows the flows of money, goods and services, and factors of production through the economy • Underlying principle is that the flow of money into each market or sector is equal to the flow of money coming out of that market or sector
The Circular-Flow Diagram Money Households Money Goods Factors and services Markets for goods and services Factor Markets Goods and Factors services Firms Money Money
Circular-Flow Diagram • The model represents the transactions that take place by two kinds of flows around a circle: • Flows of physical things such as goods; services, labor, or raw materials in one directions • Flows of money that pay for these things in the opposite direction
Circular-Flow Diagram • The simplest circular-flow diagram illustrates an economy that contains only two kinds of “inhabitants”: households and firms • Households –an individual or group of people who share their income • Firm – an organization that produces goods and services for sale and that employs members of the household
The Circular-Flow Diagram Money Households Money Goods Factors and services Markets for goods and services Factor Markets Goods and Factors services Firms Money Money
An Expanded Circular-Flow Diagram Government purchases of goods and services Government borrowing Government Taxes Government transfers Consumer spending Private savings Households Wages, profit, interest, rent Markets for goods and services Factor Markets Financial Markets Wages, profit, interest, rent Borrowing and stock issues by firms GDP Firms Foreign borrowing and sales of stock Exports Rest of the world Foreign lending and purchases of stock Imports
Expanded Circular-Flow Diagram • Consumer spending – buying goods and services from domestic firms and from firms in the rest of the world • Households also derive additional income from their indirect ownership of the physical capital used by firms – stocks • Shares in the ownership of a company • Households also receive additional income from bonds – loans to firms in the form of an IOU that pays interest • The income the household receives from factor markets includes profit distributed to company shareholders and the interest payments on any bonds that they hold • Same goes for rent from firms • In a factor market, households receive income in the form of wages, profit, interest, and rent via factor markets
Expanded Circular-Flow Diagram • Households spend most of the income received from factors of production on goods and services • Why do the markets for goods and services don’t absorb all of a household’s income? • Households don’t get to keep all the income they receive – have to pay income and sale taxes • Some households receive government transfers – payments that the government makes to individuals without expecting a good or service in return (unemployment insurance) • Total income households have left after paying taxes and receiving government transfers is disposable income
Expanded Circular-Flow Diagram • Why do the markets for goods and services don’t absorb all of a household’s income? • Many households set aside a portion of their income for private savings • The private savings go into financial markets – individuals, banks, and other institutions buy and sell stocks and bonds as well as make loans
Expanded Circular-Flow Diagram • General Characteristic of the Circular-Flow Diagram: • The total sum of flows of money out of a given box is equal to the total sum of flows of money into that box
Circular-Flow Model: Government • Government returns a portion of the money it collects from taxes to households in the form of government transfers • Government borrowing – the amount of funds borrowed by the government in the financial markets to buy goods and services • Government purchases of goods and services are the total expenditures on goods and services by federal, state, and local governments • Includes everything from military spending on ammunitions to your local public school’s spending on chalk, erasers and teacher salaries
The World • The world participates in the U.S. economy in 3 ways: • Exports • Imports • Foreigners can participate in U.S. financial markets through foreign lending and foreign borrowing • Foreign lending is lending by foreigners to borrowers in the U.S. and purchases by foreigners of shares of stock in American companies • Foreign borrowing is borrowing by foreigners from U.S. lenders and purchases by Americans of stock in foreign companies
Circular Flow -- Firms • Firms also buy goods and services in the economy • Building a new factory • Accumulate an inventory • Inventories are goods and raw materials that firms hold to facilitate their operations • National accounts count this as investment spending • Spending on new productive physical capital, such as machinery and buildings, and on inventories – as part of total spending on goods and services • Accounted for due to they change the ability of a firm to make future sales
Gross Domestic Product (GDP) • Final goods vs. intermediate goods • Final goods and services are goods and services sold to the final, or end, user • Intermediate goods and services are goods and services that are inputs into the production of final goods and services • The purchaser is another firm, not the final user
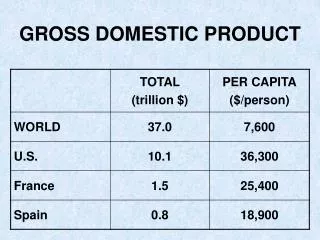
Gross Domestic Product (GDP) • Gross Domestic Product is the total value of all final goods and services produced in an economy during a given period, usually a year. • GDP of 2011 was $15,094,025 • Three ways to calculate GDP: • Survey firms and add up the total value of their production of final goods and services • Add up aggregate spending on domestically produced final goods and services in the economy GDP = C + I + G + X - IM • Sum the total factor income earned by households from firms in the economy
Gross Domestic Product (GDP) • Aggregate spending is the sum of consumer spending, investment spending, government purchases of goods and services, and exports minus imports
Calculating GDP Components of GDP (billions of dollars) $15,000 10,000 5,000 0 -5,000 Value added by government = 11.5% Government purchases of goods and services = 19.4% Value added by households = 11.5% Investment spending = 15.4% C + I + G = $14,515 Value added by business = 77.1% Consumer spending = 70.3% Value added by sector Net exports X – IM = –$708 (–5.1%) • Spending on domestically produced final goods and services
GDP: What’s In & What’s Out INCLUDED NOT INCLUDED • Domestically produced final goods and services, including capital goods, new construction of structures, and changes to inventories • Intermediate goods and services • Inputs • Used goods • Financial assets – stocks and bonds • Foreign-produced goods and services