Download

1 / 10
100 likes | 243 Views
Central Limit Theorem. General version. Statistics are. Unbiased : on average, the calculated statistic from a random sample equals in value to the corresponding population parameter.

E N D
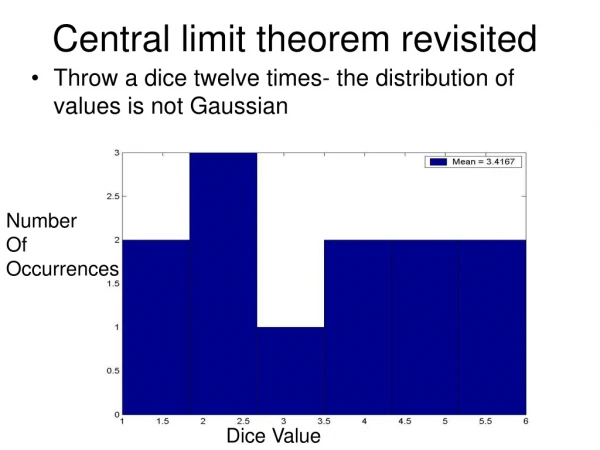
Central Limit Theorem General version
Statistics are • Unbiased: on average, the calculated statistic from a random sample equals in value to the corresponding population parameter. • Consistent: (ALL statistics contain error in estimation—however,) the error from a random sample in a statistic follows a normal distribution. • Efficient: statistics from random samples have the smallest possible error.
When? (not always) • When the sample of data drawn from the population is a randomly gathered data sample.
Example: CLT for sample means • A student group has taken over 10,000 exams during their lifetime. Assume that you know that the population mean test score for this group is 81 (m), with a population standard deviation of 6 (s). • If you take a random sample of 144 exams from the population of scores, then, describe the sample mean of these 144 sampled scores by applying the CLT.
What should the sample mean look like? What is the average amount of error in calculating a sample mean, In order to to estimate a population mean? 6/12 = 0.5 pt., n=144 What if n=64, then the std. error is 6/8 = .75 pt … The larger the sample, the smaller the statistical error Negative errors, underestimates Positive errors, overestimates 79.5 80 80.5 81.5 82 82.5 m = 81 Z -3 -2 -1 1 2 3 0
☻ P=.5 ☻’ 1-P=.5 Another example: sample proportions (polling/surveys) • Suppose you taste two colas and your job is to properly identify each brand correctly. Assume that you are equally likely to identify the drinks correctly as you are to identify the drinks incorrectly. • Suppose you gather 400 randomly selected answers to this taste test.
What should the sample proportion look like? What is the average amount of error in calculating a sample proportion, When estimating a population proportion? Std error for a sample proportion=(.5*.5/400)^.5=.025 Negative errors, underestimates Positive errors, overestimates p .425 .45 .475 .525 .55 .575 p = .5 Z -3 -2 -1 1 2 3 0
Sample exam 3 question • A random sample of 256 persons was asked an opinion question. The surveyed had two choices for a response: Agree or Not Agree. The sample percentage of those who Agreed was .25. construct a range that covers 95% of possible population proportion values for the percentage of all people who agree with this issue: .25 ± 2*(.25*.75 / 256)^.5 • (p ± 2*(p * (1-p) /n )^.5) • .25 ± 2*0.027 = [25% ± 5.4%] = 95% confidence interval estimate for the population proportion.