Download
1 / 36
360 likes | 443 Views
Join the Harvard University Initiative in Innovative Computing to explore astronomy and computational challenges, data projects, and the quest for new discoveries. Learn about extra-solar planets, statistical estimates, dark matter, cosmology, and more.

E N D
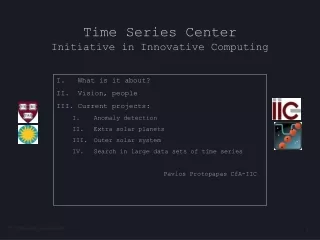
TIME SERIESCENTERHarvard University Initiative in Innovative Computing Who What Plan Projects-Challenges Pavlos Protopapas -CfA-IIC
Basic IDEA • Big idea, vague idea, promises? • Recipe • Get data • Get people that are interested in the science • Get people with skills • Get hardware
DATA-PROJECTS • Right now we have only astronomical data. • MACHO- 66 million objects. 1000 flux observations per object in 2 bands (wavelengths) • SuperMACHO - Close to a million objects. 100 flux observations per objects. • TAOS - 100000 objects. 100K flux observations per object. 4 telescopes. • ESSENCE- Thousands obejcts, hundred observations. • MPC - Few hundred objects. Few hundred observations • Pan-STARRS. Billions of objects. Hundred observations per object.
ASTRONOMY Extra-solar planets.Either discovery of extra solar planet or statistical estimates of the abundance of planetary systems Dark matter (Baryonic).Pan-STARRS will discover more lensing events in a single year than the combination of all monitoring programs which have been active to date. This is because it covers a larger area of the sky and goes deeper. Pan-STARRS data taken over an interval of several years can therefore provide the opportunity to derive reliable limits on Galactic dark matter. Cosmology. SN from PanStarrs will help determine cosmological constants. New class of variable star.Finding a new class or subclass of variable stars will be of tremendous value to astronomy. Asteroids, KBO etc. Light curves can tell us about orbits, mass. Understanding of the solar system. Killer asteroids.
COMPUTER SCIENSE-STATISTICS • Outlier/anomaly detection • Clustering • Identification of time series types • Predicting properties of series • In either case, analyzing a large data set requires efficient algorithms that scale linearly in the number of time series because even quadratic scaling incurs unrealistic run times. • The feature space in which to represent the time series (Discrete Fourier Transform, Wavelets, Piecewise Linear, and symbolic methods) • A distance metric for determining similarities in time series
COMPUTATIONAL QUESTIONS • The sizes of data sets in astronomy, medicine and other fields are presently exploding. The light curve center needs to be prepared for data rates starting in the 10’s of gigabytes per night, scaling up to terabytes per night by the end of the decade. • Interplay between the algorithms used to study the time series, and the appropriate database indexing of the time series itself. • Real-time access • Distributed Computing • VO standard. • active query • subscription
WHO • Astronomers: C. Alcock, R. DiStefano, C. Stubbs, P. Protopapas • CS: C. Brodley, R. Khardon, U. Rebbapragada • Computational: R. Dave • Statisticians: J. Rice
PLAN - KEY TO SUCCESS • DATA DATA DATA DATA. • Key to success is to get data that discoveries can be made. • All the kings algorithms and all the kings hardware can not put discoveries together. • PanStarrs is a key dataset. • Plan: 3 way • Get the data and parse them and made them available to people. • Prepare algorithms by CS • Prepare the questions by astronomers
DREAM How about if the first earth like planet outside the solar system were discovered at IIC ? How about if the first extra terrestrial life was detected from work at IIC ? Dreaming ? There is as good chance to be part of this as anybody else. Discoveries is the KEY
Projects underway • Anomaly detection. • Few outliers • Class of outliers • Extra Solar planets • Temporal symmetries/asymmetries • Binary Asteroids • Microlensing searches • Moving objects
Anomaly detection • Only periodic light curves for now. • Need to worry about phase • Define similarity. Pair wise correlation. Adjust for observational error • Time warping method. • Construct similarity matrix
Construct similarity matrix • Find outliers [weighted] averaging • Question: How many and where to stop ? • Extension 1: Compare to a centroid. Scales nicely but does not work well with not well define phase. • Extension 2: Compare to multiple centroids. Redefine K-MEANS
difficulty:each pair has a an optimal relative phase. solution:Pk-means, which stands for Phased K-means, is a modification of the k-means clustering algorithm which takes into consideration the phasing of the time-series. Scales as O(N) Algorithm 1Pk-means(Lightcurves lc, Number of centroids) 1: Initialize centroids cen 2: whilenot Convergence do 3: (closest_centroids, rephrased_lightcurves) CalcDistance(lc, cen) 4: clusters AssembleClusters(rephased_lightcurves,closest_centroids) 5: centroids RecalcCentroids(clusters) 6: end while 7: return centroids Algorithm 2CalcDistance(Lightcurves lc, Centroids cen) 1: for each lightcurve lc do 3: foreach centroid cen do 4: (corr,phase) CalcCorrelationUsingFFT(lc,cen) 5: find max correlation best phase, closest_centroid 10: end for 12: lc_phased UpdatePhase(lc, best_phase) 13: end for 14: return closest_centroids, lc_phased
Cepheid centroid Top 9 outliers from 1329 OGLE Cepheids interesting
Anomaly detection-EXTENSIONS • Do the same not just with periodic light curves • Different projections. Combine projections
Do the same not just with periodic light curves • Different projections. Combine projections • Find outlier clusters. Redefine “outliers”. • Clustering methods. • Define variability. Need a statistical test of variability. I am using wavelet decomposition. All coefficients must be zero.
Transit method-Extra solar planets searches Looking for planets at other solar systems. Transit method when a planet goes in front of the star the light from the star is blocked. Our job is to confirm that. If the survey is designed for transit searches then the problem is simple. If not then the likelihood surface is erratic.
typical light curve with non optimal sampling may look like anything
Multiple Optimized Parameter Estimation and Data CompressionMOPED Method to compress data by Heavens et al. (2000) Given data x (our case a light-curve) which includes a signal part μ and a noise n The idea is to find weighting vector bm (m runs from 1 to number of parameters) that contains as much information as possible about the parameters (period, duration of the transit etc.). These numbers ym are then used as the data set in a likelihood analysis with the consequent increase in speed at finding the best solution. In MOPED, there is one vector associated with each parameter.
MOPED Find the proper weights such as the transformation is lossless. Lossless is defined as the Fisher matrix remains unchanged at the maximum likelihood. The Fisher matrix is defined by: The posterior probability for the parameters is the likelihood, which for Gaussian noise is (alas needs to be Gaussian) If we had the correct parameters then this can be shown to be perfectly lossless. Of course we can not know the answer a priory. Nevertheless Heavens et al (2000) show that when the weights are appropriate chosen the solution is still accurate.
MOPED The weights are (complicated as it is) Where comma denotes derivatives. Note: C is the covariance matrix and depends on the data is the model and it depends on the parameters. Need to choose a fiducial model for that
MOPED Now what we do with that? Write the new likelihood Where qf is the fiducial model and q is the model we are trying out. We choose q and calculate the log likelihood in this new space. WHY ? If the covariant matrix is known (or stays significantly same) then the second term needs to be computed only once for the whole dataset (because it depends on fiducial model and trial models) So for each light-curve I compute the dot-product and subtract. But there is more (do not run away)
Transit models • We need to choose a model for our transits • Four free parameters: • Period, P • Depth, • Duration, • Epoch, • Note: A more realistic model can easily be made using tanh
Multiple Fiducial models For an arbitrary fiducial model the likelihood function will have several maxima/minima. One of those maxima is guaranteed to be the true one. If there was no noise this would have been exact. For an another fiducial model there again several maxima/minima. One of those maxima is guaranteed to be the true one Combine several fiducial models and eliminate all but the true solutions. We define a new measure
Y as a function of period. First panel is after 3 fiducial models Second panel after 10 fiducial models Third panel after 20 fiducial models. Synthetic light curves: One 5 measurements/hour, total of 4000 measurements. S/N=5
Confidence levels Assume Gaussian error (can be done with Poisson) No transit signal Y follows a non-central 2 distribution mean and variance We can estimate the error and thus the confidence of our results. But before lets make sure that I did this right.
Y as a function of period for synthetic light curve. Each panel shows different S/N Dotted line shows 80% confidence level.
KBO-Temporal Symmetry/Assymetry Hsiang-Kuang Chang, Sun-Kun King, Jau-Shian Liang, Ping-Shien Wu, Lupin Chun-Che Lin and Jeng-Lun Chiu, Nature 442, 660-663(10 August 2006) X RAY data from RXTE (high time resolution data) from SCO-X1 (the second brighter x-rays source) A trans-Neptunian object passes in front of a star, thus occulting the light.
Looking for a statistical test for temporal asymmetry My method (under development). Assume time symmetry at If symmetric then Q follows a chi-square distribution. Assume errors are Gaussian They are definitely not ! QUESTIONS: What do I do ?
Binary Asteroids. Looking for binary asteroids. Look for tracks in the HST archive Bayesian approach !