Download
1 / 30
300 likes | 450 Views
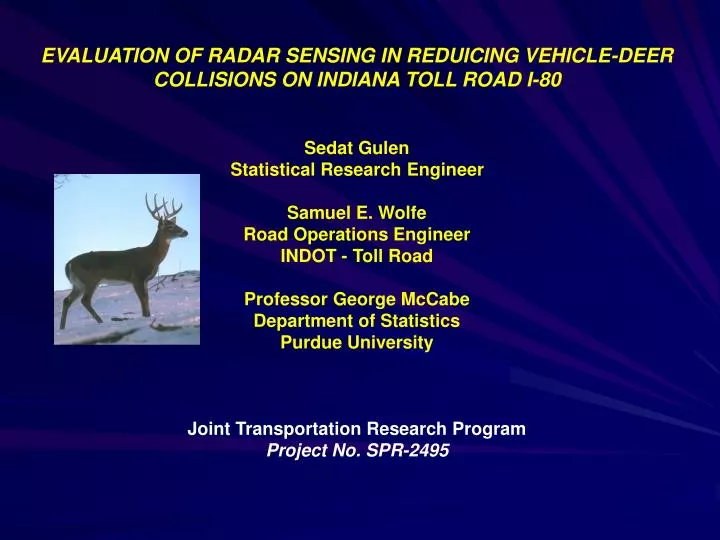
EVALUATION OF RADAR SENSING IN REDUICING VEHICLE-DEER COLLISIONS ON INDIANA TOLL ROAD I-80 Sedat Gulen Statistical Research Engineer Samuel E. Wolfe Road Operations Engineer INDOT - Toll Road Professor George McCabe Department of Statistics Purdue University

E N D
EVALUATION OF RADAR SENSING IN REDUICING VEHICLE-DEER COLLISIONS ON INDIANA TOLL ROAD I-80 Sedat Gulen Statistical Research Engineer Samuel E. Wolfe Road Operations Engineer INDOT - Toll Road Professor George McCabe Department of Statistics Purdue University Joint Transportation Research Program Project No. SPR-2495
CRASH COST StateFatal Injury A Injury BInjury CPDO Arizona $3,000,000 $210,000 $42,000 $22,000 $3,000 Iowa $1,000,000 $150,000 $10,000 $ 2,500 $2,500 Louisiana $3,000,000 $ 63,000 $63,000 $ 63,000 $2,300 Maine $2,600,000 $180,000 $36,000 $19,000 $2,000 Nebraska $3,770,000 $316,000 $66,900 $34,900 $6,200 Oregon $1,350,000 $1,350,000 $55,000 $55,000 $13,000 Texas $ 854,000 $854,000 $41,000 $41,000 $1,400 Vermont $3,400,000 $260,000 $56,000 $27,000 $4,000 INDIANA: Yearly: 16,000 deer-vehicle collision; $22 million Property damage; 3 Fatalities. State Farm Reports nationwide from July 1, 2004 to June 30, 2005: 1 million deer_vevicle collisions; 150 deaths; $1.1 Billion in vehicle damages: (Average PDO Claim=$11,100)
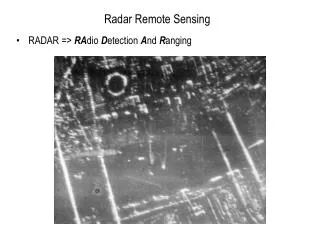
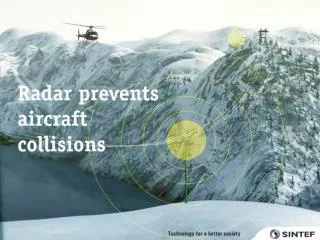
OBJECTIVE The overall objective of this project is to evaluate The Radar Sensing Approach developed by “Sensor Technologies & Systems, Inc.” in reducing vehicle-deer collisions on Indiana Toll Road
There are two Peaks as seen in the graph: • Smaller peak ( May to June); • more probably due to: • - Fawning and • - Increased nutritional requirements of razing young cause females to travel more. • - Availability of high quality of food cause travel • Larger Peak ( October to November): • more probably due to: • - Breeding season; animals are more active and careless • - Hunting season cause extensive movement • - Lack of food can cause greater travel. .
Location of the the experiment on I-80/90 between Mile Markers 130 and 143.
DESIGN OF EXPERIMENT The Following is the Design of Experiment actually used to place radar sensors and the control sections in between on I-80/90 Toll Road in Indiana. There is two replicates and this design is statistically sound and valid. The radar system has been functional since October 2004 and deer-vehicle accident data has been collected daily and reported monthly. The unit of data for the Poisson Regression is the total amount of Deer-Vehicle collisions per mile.
Deer Sensors Milepost 130 – Milepost 142 I-80/90 Indiana Toll Road The Indiana Toll Road in cooperation with the Indiana Department of Transportation Research Division, Purdue University and the University of Montana installed 72 sensors ( 6 per mile rather than 4 due to over-pass bridges and curving) and are testing an animal detection/warning system. The system uses radio frequency transmitters and receivers to send a beam parallel to the road. If an animal (most likely a deer) breaks the beam, the flashing yellow beacons turn on and flash for two minutes to warn the drivers.
The system is 100% solar powered and each mile of the test area operates independently from the other locations. Each system is connected to a cell phone for remote monitoring, checking and data collection. The system was activated in 10/2004.
YEAR MONTHGROUPDEER-VEHICLE COLLISION 2004 October Control 10 2004 October Radar 6 2004November Control 10 2004 November Control 5 2005 May Control 13 2005 May Radar 13 2005 June Control 4 2005 June Radar 10 2005 October Control 14 2005 October Radar 11 2005 November Control 14 2005 November Radar 18 PRELIMINARY STATISTICS
PRELIMINARY STATISTICS 2006 May Control 7 2006 May Radar 16 2006 June Control 8 2006 June Radar 6 2006 October Control 1 2006 October Radar 7
PRELIMINARY CONCLUSIONS • High Accident Months Data (May to June& October to November) will be used in the statistical analyses. • Current data from 2004 to 2006 was not enough to make any statistical conclusion • Data collection will continue for another 2 or 3 years. • Following variables were selected for Poisson Regression Models: • a. Dependent variable: • Number of Deer_vehicle collisions per mile per month. • 2.
b. Independent Variables Months, Years and Treatments, 14 of them: ( 1-mile long radar sections , total of 6 and 1-mile long control sections, total of 8). 5- The Vehicle-Deer collisions data will be used to compare these 14-treatments to evaluate the effectiveness of radar sensing systems combined with reactions of drivers.
RADAR SPECIFICATIONS & CONTACT INFORMATION Terry_Wilson@sensor-tech.com 8900 East Chaparral Road, Scottsdale, Arizona 85250 Phone: (480) 483-1997 Fax: (480) 483-2011 www.sensor-tech.com