Download
1 / 44
440 likes | 530 Views
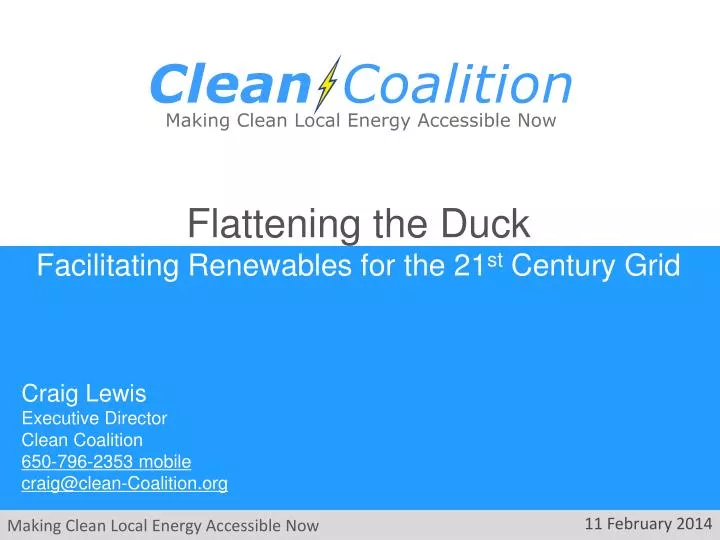
Flattening the Duck Facilitating Renewables for the 21 st Century Grid. Craig Lewis Executive Director Clean Coalition 650-796-2353 mobile craig@clean-Coalition.org. 11 February 2014. Clean Coalition – Mission and Advisors.

E N D
Flattening the Duck Facilitating Renewables for the 21st Century Grid Craig Lewis Executive Director Clean Coalition 650-796-2353 mobile craig@clean-Coalition.org 11 February 2014
Clean Coalition – Mission and Advisors MissionTo accelerate the transition to local energy systems through innovative policies and programs that deliver cost-effective renewable energy, strengthen local economies, foster environmental sustainability, and provide energy resilience Board of Advisors L. Hunter LovinsPresident, Natural Capitalism Solutions Ramamoorthy RameshFounding Director, DOE SunShot Initiative Governor Bill RitterDirector, Colorado State University’s Center for the New Energy Economy, and Former Colorado Governor Terry TamminenFormer Secretary of the California EPA and Special Advisor to CA Governor Arnold Schwarzenegger Jim WeldonTechnology Executive R. James WoolseyChairman, Foundation for the Defense of Democracies;Former Director of Central Intelligence (1993-1995) Kurt YeagerVice Chairman, Galvin Electricity Initiative; Former CEO, Electric Power Research Institute Eric GimonIndependent Energy Expert Patricia GlazaPrincipal, Arsenal Venture Partners Mark Z. JacobsonDirector of the Atmosphere/Energy Program & Professor of Civil and Environmental Engineering, Stanford University Dan KammenDirector of the Renewable and Appropriate Energy Laboratory at UC Berkeley; Former Chief Technical Specialist for RE & EE, World Bank Fred KeeleyTreasurer, Santa Cruz County, and Former Speaker pro Tempore of the California State Assembly Felix KramerFounder, California Cars Initiative Amory B. LovinsChairman and Chief Scientist, Rocky Mountain Institute Jeff AndersonCo-founder and Former ED, Clean Economy Network Josh BeckerGeneral Partner and Co-founder, New Cycle Capital Pat BurtCEO, Palo Alto Tech Group; Councilman & Former Mayor, City of Palo Alto Jeff BrothersCEO, Sol Orchard Jeffrey ByronVice Chairman National Board of Directors, Cleantech Open; Former Commissioner, CEC Rick DeGoliaSenior Business Advisor, InVisM, Inc. John GeesmanFormer Commissioner, CEC
There are Three Vital Grid Services The Duck Chart only addresses Power Balancing but Distributed Energy Resources deliver unparalleled location and speed characteristics
Is this Duck Real or a Decoy for Natural Gas? Source: CAISO/NERC report (Nov 2013)
Natural Gas Is Not The Solution Future generations will be asking what we were thinking (or smoking). You allowed massive quantities of toxic chemicals to be injected into the earth, and to contaminate ungodly volumes of water, in pursuit of a highly flammable gas that would be routed through your neighborhoods and into your homes?! What were you thinking? 2010 San Bruno pipeline explosion
Natural Gas Has Integration Costs • Source: CAISO Summer Loads and Resources Assessment (2013) More than half of the outages associated with conventional generation are unplanned Natural gas plants often shut down unexpectedly, forcing energy consumers to foot the bill for reserves and frequency response.
Integrating Renewables in a Forward Direction • Use cost-effective, renewables and intelligent grid solutions to modernize the grid. • Minimize natural gas, which would move backward from California’s goals.
Wholesale DG is the Critical & Missing Segment Project Size Central Generation Serves Remote Loads 50+ MW Wholesale DG Serves Local Loads 500 kW Retail DG Serves Onsite Loads 5 kW Distribution Grid Transmission Grid Behind the Meter
WDG Delivers Scale & Cost-Effectiveness Fast Solar Markets: Germany vs California (RPS + CSI + other) Cumulative MW Sources: CPUC, CEC, SEIA and German equivalents. Germany has deployed 12 times more solar than California in the last decade despite California’s 70% better solar resource!!!
German Solar Capacity is Small WDG (Rooftops) 26% 23.25% 22.5% 19% 9.25% Source: Paul Gipe, March 2011 Germany’s solar deployments are almost entirely sub-2 MW projects on built-environments and interconnected to the distribution grid (not behind-the-meter)
Renewables + Intelligent Grid Solutions = Reliable 2012 Solar PV Capacity as % of Peak Demand Source: Union of Concerned Scientists, SEIA 2013 The German power system, which incorporates enough rooftop solar to meet half the country's peak energy needs, set a global reliability record in 2011.
Align Renewables Integration with CA Goals • AB 32 (Reduce GHG emissions to 1990 levels by 2020) • Loading Order (Procure cost-effective preferred resources first) • Energy Storage Target (1.325 GW by 2020) • Electric Vehicles Target (1.5 million EVs by 2025) • Zero Net Energy (IOUs proposed “district” rather than building level ZNE) • All new residential construction ZNE by 2020 • All new commercial construction and 50% existing commercial retrofit to ZNE by 2030
Hunters Point Project in San Francisco Get 25% of electric energy consumed within Hunters Point substation (Bayview and Hunters Point neighborhoods) from local renewables while at least maintaining grid reliability and power quality
Hunters Point Economic Benefits from 50 MW New DG $200M in Private Investment + Operations & Maintenance Over 20 Yrs. Equals: Photo courtesy of GRID Alternatives • Economic Benefits • $200M: Added regional economic stimulation • $100M: Added local wages, near-term plus annual • 1,270 Job-Years: New near-term regional employment • 520 Job-Years: New ongoing regional employment • $10M: Site leasing income for property owners • $5.8M: Added construction-related state sales taxes Source: NREL JEDI calculator. Based on average installed cost of $2.75/W(dc) before taxes & incentives using PG&E rates/region.
St. John Project in Virgin Islands: Local PV with Advanced Inverters to Maintain Grid Reliability
Distributed Voltage Regulation – Location Matters • “The old adage is that reactive power does not travel well.” • Oak Ridge National Laboratory (2008) T&D lines absorb 8-20x more reactive power than real power. Prevent Blackouts: When a transmission path is lost, remaining lines are heavily loaded and losses are higher. Source: Oak Ridge National Laboratory (2008)
Replace SONGS – DG/Storage + Advanced Inverters vs. $80 million 2 Synchronous Condensers San Luis Rey Substation450 MVAr (minus line losses = 400 MVAr) 800 MW of DG solar + storage with advanced inverters, oversized by 10% set at 0.9 Power Factor = 400 MVAr CAISO proposed 320 MW DG solar + 580 MW storage = 900 MW (plus 1,400 MW of nat gas)
The California ISO Duck Chart (2012 – 2020) 13,100 MW 5-8pm 5,300 MW 8-11am Potential over-generation
CAISO Duck Chart (2020 Issues) 13,100 MW 5-8pm 5,300 MW 8-11am Potential over-generation
Flattening the Duck – Import/Export Import/Export Need to study how much California can export, expected pricing, and whether additional regional coordination is advisable
Flattening the Duck – Demand Response Demand Response California set a target of 1.5 million electric vehicles by 2025, representing an additional load of 10,000 MW
Flattening the Duck – Energy Storage Energy Storage California set a target of 1.325 GW of new cost-effective storage by 2020
Flattening the Duck – Curtail Solar Curtailment Can also curtail baseload by scheduling maintenance during shoulder months
Flattening the Duck – Aggregated Solutions The reflected aggregated solutions include imports/exports, demand response, energy storage and solar curtailment
Avoided Transmission in CA = $80 Billion over 20 yrs Business as Usual Year-20 TAC (TAC20 ) = 2.7 2.7 Business As Usual TAC Growth Current TAC Rate (TAC0) = 1.2 TAC0 O&M Level Business as Usual TAC Growth TAC0 Depreciation + O&M Avoided TAC Opportunity from DG
Guided Siting: Locational Value, Interconnection SCE Share of 12,000 MW Goal • Locational Value methodology should include transmission costs. • Interconnection policies should favor high value locations, reduce cost uncertainty for developers. Guided Siting Saves Ratepayers 50% Source: SCE Report May 2012
Import/Exports – Transmission Not the Issue 2012 Peak Daily ISO Imports = ~11,500 MW Source: CAISO 2013 Summer Loads & Resources Assessment (May 6, 2013)
Advanced Inverters – Reactive Power Advanced Inverter at 0.9 Power Factor = 43.6% reactive power REACTIVE (Q) P: Real power (kW) Q: Reactive power (kVAr) S: Total power (kVA) S 100% Q 43.6% REAL (P) 100 kW solar PV AC power 100 kVA inverter capacity 0.9power factor 43.6 kVArreactive power 90 kW real power P 90% Standard-sized inverter: Diverts up to 10% solar capacity to provision reactive power
Advanced Inverters – Reactive Power (Oversized) REACTIVE (Q) P: Real power (kW) Q: Reactive power (kVAr) S: Total power (kVA) S 110% 100 kW solar PVAC power 110 kVA inverter capacity 0.9 power factor 45.8 kVArreactive power 100 kW real power Q 45.8% REAL (P) P 100% • Oversized inverter: • No reduction of PV real power • Draws up to 10 kW real power from the grid • Provides reactive power 24/7/365
Regulation: Faster, More Accurate Solutions Ideal flexible resources should look like storage, not natural gas – faster, more accurate, cleaner, and full capacity to dispatch and absorb power. Flywheel Storage Conventional Spinning Generator Storage provides both supply and demand Faster and more accurate regulation = less MW required
Advanced Inverters Keep Voltage in Balance Advanced inverters have been programmed to deliver reactive power in Germany and Georgia Power’s territory. Proposed changes to IEEE 1547a and UL standards will allow advanced inverters to provide reactive power for voltage regulation in California. Source: EPRI(2011)
Flattening the Duck – Demand Response • Source: PG&E and CPUC meeting 12/11/2013
German Solar Pricing Translates to 5 cents/kWh Source: http://www.wind-works.org/cms/index.php?id=92, 10 September 2013 • Conversion rate for Euros to Dollars is €1:$1.309 • California’s effective rate is reduced 40% due to tax incentives and then an additional 33% due to the superior solar resource Replicating German scale and efficiencies would yield rooftop solar at only between 5 and 7 cents/kWh to California ratepayers
PV Potential of Top 25 Roofs in LA is Over 75 MW 100+ GW of Built-Environment Solar Potential in California vs 60 GW of Peak Load
Flattening the Duck – Curtail Baseload Source: CAISO/NERC variable resources integration report (Nov 2013)
Benefits of Modernizing the Grid • Power Quality, Reliability & Resilience benefits • Increased customer satisfaction • Improved equipment longevity • Sustained vital services in otherwise complete blackout scenarios • Avoided transmission & central generation vulnerabilities • Economic benefits • Significant private-sector investment • Substantial local job creation • Fixed electricity prices for 20+ years • Localized energy spending • Avoided inefficiencies of central generation & transmission • Environmental benefits • Avoiding dirty power generation, including nasty peaker plants that are often sited in underserved communities • Utilizing built-environments and disturbed lands for generation projects • Preserving pristine environments from transmission lines and other infrastructure
Replace SONGS – Solar PV + Advanced Inverters vs Huntington Beach 290 MVars (minus line losses = 261 MVars) 570 MW of local solar with advanced inverters, oversized by 10% set at 0.9 Power Factor = 261 MVArs