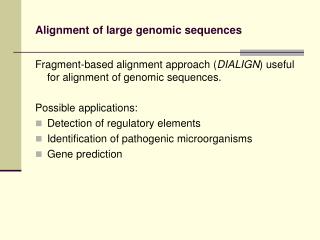
Download

1 / 13
130 likes | 288 Views
genomic analysis of regulatory network dynamics reveals large topological changes. Paper Study Speaker: Cai Chunhui Sep 21, 2004. Introduction .

E N D
genomic analysis of regulatory network dynamics reveals large topological changes Paper Study Speaker: Cai Chunhui Sep 21, 2004
Introduction • The dynamics of a biologicalnetwork on a genomic scale is presented by way of integrationof transcriptionalregulatory information and gene-expression data formultiple conditions in Saccharomyces cerevisiae. • SANDY is developed as a new approach for the statistical analysis of network dynamics,combining well-known global topological measures,local motifs and newly derived statistics.
Main Work • Integrate gene-expression data for the following five conditions: cell cycle,sporulation, diauxic shift, DNA damage and stress response. • Fig. 1 represents the first dynamic view of agenome-scale network: the sub-networks active under differentcellular conditions and standard statistics under different conditions
Main Work • The follow-on statistics inSANDY (Fig. 2) indicates several characteristics of the regulatory system: scale-free, hubs would be invariant features of the network across conditions and the combinatorial transcription factor usage while not the individual one seems to be the key of the regulation of a condition.
Result • SANDY presents an approach to examine biological networkdynamics. • Inrefocusing to a dynamic perspective, the author uncover substantial topologicalchanges in network structure, and capture the essence ofthetranscriptional regulatory data in a new way.
Further Study • future experiments can be used to determine condition-specific interactionsdirectly. • Manyof the concepts introduced could be readily transferred toother types of biological networks and complex sub-systems inmulticellular organisms (such as those directing the circadian cycleand cellular development).
SANDY • SANDY (Statistical Analysis of Network Dynamics) is spread into three parts: • Well-known statistics (global topological measures, local network motifs). • Newly-derived follow-on statistics (hub usage, interchange index, TF usage). • Statistical validation with randomly simulated networks
Good Point (Local network motifs) • There are three motifs which show the precise inter-connections between a small number ofTFs and target genes • We are very interested in the local network motifs, and thus find out the way in which they are identified.
Good Point (Local network motifs) In order to identify the motifs, the author constructed a pair of affinity matrices A and B. MatrixA contained binary entries Aij where a 1 indicated a regulatory interaction from TF j totarget gene i. Matrix B was a sub-matrix of A, containing only the rows corresponding totarget genes that are TFs themselves. Nodes and edges can be part of more than one motif.