Download
1 / 21
210 likes | 384 Views
Integrated analysis of regulatory and metabolic networks reveals novel regulatory mechanisms in Saccharomyces cerevisiae. Speaker: Zhu YANG 6 th step, 2006. Reference.

E N D
Integrated analysis of regulatory and metabolic networks reveals novel regulatory mechanisms in Saccharomyces cerevisiae Speaker: Zhu YANG 6th step, 2006
Reference • Herrgard, M.J., Lee, B.-S., Portnoy, V., and Palsson, B.O. 2006. Integrated analysis of regulatory and metabolic networks reveals novel regulatory mechanisms in Saccharomyces cerevisiae Genome Research, 16: 627 – 635. 16: 627
Outline • Background • Approach model-based analysis • Data and information • Reconstructed transcriptional regulatory network • Prediction of gene expression changes • Systematic expansion of the regulatory network • Prediction of growth phenotypes • Discussion • Conclusions
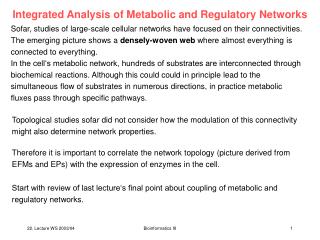
Background • With the rapidly increasing biological productions, the data integration and interpretation task is made challenging by the incompleteness and noisiness of large-scale data sets. • literature-derived information has enabled the reconstruction of chemically and biologically consistent mathematical descriptions of biochemical networks in well-studied model organisms. And Furthermore, model predictions can be directly compared with experimental data obtained. • Using a reconstructed genome-scale stoichiometric matrix as a starting point, the constraint-based modeling framework can then be used to make phenotypic predictions that can be compared to experimental data. Frequently used constraint-based approaches include flux balance analysis (FBA) and regulated flux-balance analysis (rFBA) approach.
Data and information • The regulatory network model, iMH805/775, is combined with an existing genome-scale metabolic model, iND750. • The relevant literature for each metabolic and transcription factor gene was collected through information in the SGD, YPD, and MIPS databases and direct PubMed searches.
Reconstructed transcriptional regulatory network • Starting point: iND750 • The regulatory network model part of iMH805/775 consists of three layers which were implemented as Boolean rules derived from primary literature of iMH805/775. • The first layer: activities of 55 TFs in response to 67 extracellular and 15 intracellular metabolite concentrations. • The second layer: the rules describing the expression of 348 metabolic genes as a function of the transcription factor states and metabolite concentrations in cases in which the direct regulatory mechanisms were unknown. For the remaining metabolic genes, no information on regulation could be found in the literature, and they were assumed to be constitutively expressed in all environmental conditions. • The third layer: the gene–protein–reaction associations that encode the relationship between gene expression and presence/absence of a particular reaction in the network.
Reconstructed transcriptional regulatory network (Cont’d) • iMH805/775 accounts for 805 genes and 775 regulatory interactions, and the network consists of the 750 metabolic genes in iND750 and 55 specific nutrient-regulated transcription factors (TFs). • The model allows 82 distinct intra- and extracellular metabolites to act as input signals to the regulatory network. • iMH805/775 also includes rules describing the mode of combinatorial control by different TFs at each promoter. • This logic-based representation allows in silico prediction of gene expression changes in response to environmental and genetic perturbations and integration of the regulatory network to the metabolic network model as described previously.
Prediction of gene expression changes • In silico gene expression change predictions were compared to experimentally measured expression profiles as well as experimentally determined protein–DNA interactions (ChIP-chip) and predicted TF-binding motifs to assess the completeness of the iMH805/775 network. • Gene expression data for eight transcription factor knockout strains (rgt1, rox1, gat1, hap1, adr1, gal4, gln3, cat8) and two overexpression (HAP4, GCN4) strains from previously published reports were used • Each of genes was classified as significantly up-regulated, significantly down-regulated, or unchanged in each of the 10 experimental data sets.
Systematic expansion of the regulatory network • In order to improve the predictive ability of the in silico model, ChIP-chip and TF-binding motif data were used to systematically expand the regulatory network part of the model. • First, the gene expression comparison presented above was used to identify potential novel candidate target genes for each of the 10 transcription factors (498 TF-target pairs total). • Next, we traced paths through an expanded regulatory network that consisted of the iMH805/775 network and a provisional regulatory network that can be established based on combining ChIP-chip data and TF-binding motif data.
Systematic expansion of the regulatory network (Cont’d) • Three different network expansion scenarios were investigated. • Only ChIP-chip and motif data for the 55 TFs already included in the model were used. And the direction of the expression change for each target gene would be correctly explained as a combination of the regulatory interactions along the path when each TF was considered to be either a repressor or activator depending on its known activity. • The same set of ChIP-chip and motif data sets was used, but the assumption that specific transcription factors can only act as activators or repressors was relaxed. • ChIP-chip and motif data for all 203 TFs studied in Harbison et al. were included , again allowing each TF to act either as a repressor or activator.
Regulatory interactions not included in iMH805/775 that participate in 15 or more regulatory cascades identified by the network expansion approach
iMH805/775 and iMH805/837. • Each of the suggested regulatory interactions involving the 55 TFs in the original iMH805/775 model was analyzed manually and included the interactions that did not cause conflicts with existing regulatory rules to form an expanded model, iMH805/837.
Prediction of growth phenotypes • In order to provide data for an evaluation of the predictive power of the integrated regulatory and metabolic network model iMH805/837, quantitative growth phenotyping experiments on 12 different carbon sources with 10 TF deletion strains were performed . • To identify potential novel regulatory mechanisms that would improve model predictions, metabolic genes whose deletion in iMH805/837 would result in a reduced in silico growth rate prediction compared to the wild-type strain specifically on each carbon source were identified. • The number of cases of which the growth rates were significantly overpredicted was reduced from 13 to 8.
Discussion • Comparison of the predictions with large-scale experimental data allowed identifying regulatory mechanisms missing from the model and expansion of the model by using existing ChIP-chip and promoter motif data. • The overall agreement between in silico gene expression predictions by iMH805/775 and experimental data was found to be relatively low. • Using ChIP-chip and motif data sets to systematically expand the iMH805/775 model allowed explaining one-third of the gene expression prediction discrepancies through hypothetical regulatory cascades involving the 55 TFs in the model. • Including ChIP-chip and motif data for additional TFs that are not traditionally assumed to be key regulators of metabolic processes almost doubled the number of gene expression discrepancies that could be explained through regulatory cascades derived from the data. • The predictions of growth rates of TF deletion strains made by the iMH805/837 model were in good agreement with experimentally measured growth rates for most TF/carbon source combinations.
Conclusions • It was found that the integrated metabolic/regulatory network model could be used to predict growth phenotypes, and the discrepancies in these predictions could be used to direct the search for novel regulatory mechanisms. • The present work shows how a systematic approach can be used to fill in missing regulatory mechanisms through the combined use of an integrated model of regulation and metabolism and existing large-scale experimental data sets. • In the future, the combination of more targeted expression profiling, ChIPchip, growth phenotyping, and metabolic flux profiling under many different environmental conditions will allow systematic iterative model building.