Download
1 / 27
280 likes | 439 Views
Andrew G. MacPhee 17 th Topical Conference on High Temperature Plasma Diagnostics Albuquerque , NM Wed 14 th May 2008. Diagnostics for Fast Ignition Science. Lawrence Livermore National Laboratory, P. O. Box 808, Livermore, CA 94551.

E N D
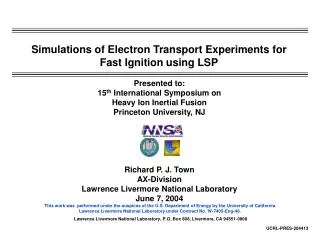
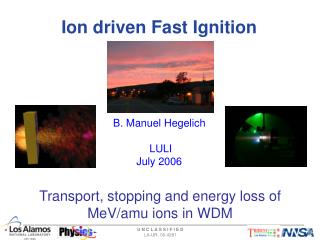
Andrew G. MacPhee 17th Topical Conference on High Temperature Plasma Diagnostics Albuquerque,NM Wed 14th May 2008 Diagnostics for Fast Ignition Science Lawrence Livermore National Laboratory, P. O. Box 808, Livermore, CA 94551 This work performed under the auspices of the U.S. Department of Energy by Lawrence Livermore National Laboratory under Contract DE-AC52-07NA27344 UCRL-PRES-403581
Collaborators J. Bonlie,R. Coombs,H. Chen,M. Foord,S. P. Hatchett, D. Hey, A.J. Kemp, M. H. Key, A. B. Langdon, B. F. Lasinski, A. J. Mackinnon,B. Maddox, N. Izumi, H-S. Park, P. K. Patel, T.H.Phillips, D. Price,M. Tabak, R. Town L. D. Van Woerkom, R.R. Freeman, E. Chowdhury, D.W. Schumacher,D. Offermann, T. Link, V. Ovchinnikov F. Beg,T. Bartal, S. Chawla, T. Ma,J. King, J. Pasley, B. Westover, M.S. Wei R. Stephens, K. Akli C. Chen, M. Porkolab, MIT, USA Y.Y. Tsui, University of Alberta, Canada
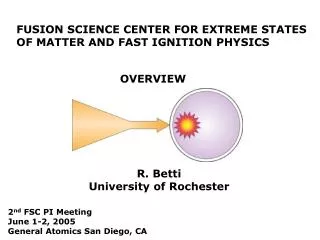
Fast Ignition*: Initiate burn prior to peak compression with an intense beam of energetic electrons *M. Tabak, J. Hammer, M.E. Glinsky, et al, Phys. Plasmas 1, 1626 (1994); S. Atzeni, et. al, Phys. Plasmas 14, 052702 (2007) Density plot from 2D indirect drive fast ignition hydro design For efficient burn with low driver energy 1.5 <R<2 gcm-2 For high gain with low driver energy 300 < < 500 gcm-3 Ignition 18 kJ in 23 ps , =36 m , 1.1x10²⁰ Wcm-2 Laser intensity must reach several 1020 Wcm-2 in ~20ps 1) How efficiently can we couple 1-3 MeV electrons to the imploded plasma? 2) How much pre-formed plasma can we tolerate? ~100m • Integrated experiments on Omega-EP, NIF-ARC and FIREX will use neutron yield and fluorescence from tracers to measure efficiency and transport • Short pulse experiments on Titan allow diagnostics development, pre-pulse evaluation and code benchmarking
Scope of talk • On shot laser diagnostics at Titan • Electron energy deposition and transport • Measuring the hot electronspectrum
150J 0.6ps, 1 from pulse compressor 2, 1ps, 10mJ probe beam Full aperture retro-focus system ` Pre-pulse monitor ` Initial set-up microscope Equivalent plane monitor Interferometer On shot diagnostics are an essential record for modeling experiments 6m lens
SF ~ 5 mJ Spike ~ 2.5mJ -3 ns -0.1 ns 0 -5 5 Time (ns) The pre-pulse monitor is vital for modeling laser target interaction *Ying Tsui, University of Alberta
Together, interferometry and pre-pulse measurements let us benchmark hydro codes 150J, 2ps shot on 25m aluminum foil: 70 mJ SF + 30 mJ spike Castor2 simulation with U of A EOS for Al: Interferogram: 1022 (+) ne interferogram data (-------) ne simulation: 100 mJ SF only (-------) ne simulation: 70 mJ SF + 30 mJ spike 1021 1020 Ne (cm-3) Density plateau due to spike 1019 1018 1017 50 100 200 250 150 0 Z(um) Electron density from interferograms agree well with 2D hydro using pre-pulse data *Ying Tsui, U of A, ** Sebastian Le Pape LLNL
Fraction of power above given intensity: Full shot Low power (scaled) 50% >4x10¹⁹ 20% >1020 There is good agreement between equivalent plane images for system shots and the low power alignment pulse System shot #02042408 Low power (OPCPA) alignment pulse Binned lineouts through both spots: Full shot Low power (scaled)
Cu fluor layer: k- fluorescence measures hot electron yield Titan Laser 150J, 0.6ps, ~1020Wcm-2 e- Bremsstrahlung + k- e- e- Thick rear Al layer: Electrons make only one pass through Cu tracer Thin front Al layer: No laser excitation of Cu k- These experiments rely on k- fluorescence for measuring coupling efficiency and Bremsstrahlung spectra for measuring Thot
Specular reflection Single hit CCD Calibrates… …absolute K-a yield from HOPG crystal spectrometer Signal (Ph/J/Sr/eV) XUV multilayer imager axis Energy (keV) Long pulse beam introduces controlled pre-pulse Temperature map K-a crystal imager axis Thot diagnostic Hot e-spatial distribution Multiple diagnostics on Titan are used to characterize energy deposition, conversion efficiency and the hot electron spectrum Main pulse ~140J 600fs ~1020Wcm-2
Ray-trace K- image Laser bounce The reflection of laser light from oblique targets is important for coupling in cones* Laser incident at angle to target surface Cu foil target Spectralon™ plate • Laser light reflected from cone wall can provide useful energy at the tip • Reflection at 75º to normal ~20x reflection at 28º • S and P have similar reflectivityat 75º • f/3 incident beam scatters ~diffusely into a f/2 cone of rays Image recorded on 16bit CCD *Tony Link, OSU, HELDA 2008
Back illuminated CCD Plane XUV mirror Filter Laser: 1m, 150J 0.6ps, ~1020Wcm-2 Spherical XUV multilayer mirror XUV images measure the black body temperature at the rear surface of the target* • Ultra intense laser-target interactions create MeV electrons • Planckian emission from rear surface peaks in the XUV • Temperature corresponds to Lasnex 2d rad. hydro run with matching integrated XUV signal within mirror bandwidth • Used to constrain hybrid PIC codes 25m CD target image at 256eV Tight focus peak intensity 1020Wcm-2 Te from 256eV channel Te from 68eV channel *Tammy Ma, These proceedings (B15)
Cu foil target 500 m Laser A spherically bent crystal imager is used to measure the k- source size 30m Cu foil, 500m x 500m ~5.1018 Wcm-2 Spherically bent quartz (211) 2d: 3.082Å, B @ n=2, 8.04keV=1.31° ~60m FWHM Image plate or CCD • Crystal imager for Cu K- radiation: 5eV bandwidth, 10x magnification, 20m resolution => hot electron source size • Line shift due to ionization of low Z Cu tracer limits crystal imager effectiveness for hot plasmas* • For higher opacity integrated experiments a 16keV imager (Zr K-) is being developed that if successful will be less sensitive to line shift J.A. Koch et al., Rev. Sci. Instrum. 74, 2130 (2003), *K.U. Akli, Phys. Plasmas 14, 023102 (2007),
Mo Filter Pd Filter A pinhole camera with Ross pair filtering is insensitive to k- line shift in hot plasmas 6x6 Ta pinhole array 30m , 500m thk Image plate 30m Mo ~12 m Ag target 20m Pd Laser Pinhole limited width <30m • Contrast K / Brem: ~1.4 • Signal to background: ~6:1 • Absolute calibration is in progress
5e21 Density on axis 750 m 15mJ 2ns nc nc @ 60mm 60mm 1e18 300m Anticipated NIF-ARC scale pre-pulse Titan: ~1J pre-pulse nc at 80m, ne ~1019 at 300m 1e22 <20% deposited within 200mm` 4.5J 300ps <20% K- yield within 200m of tip nc 2e19 nc @ 80mm 80mm Cu K- image 1e15 300m K- imaging and Lasnex modeling show pre-pulse in cones is a significant issue Lasnex hydro of pre-pulse plasma: Titan: 15mJ pre-pulse ~80% K-a yield within 200mm of tip ~80% deposited within 200mm` Cu K- image See also Sophie Baton, LULI, submitted to POP
A HOPG crystal spectrometer measures the absolute K- yield produced by hot electrons in the buried tracer layer HOPG spectrometer Image Plate Direct Block Cu k- 8keV 9758 eV Cu k- 8.9keV TCC crystal k- signal from HOPG normalized against single hit CCD averaged over several shots *K. Akli, GA, These proceedings
k- event counts k yield = Filter Tx × solid angle × CCD× Laser energy Single hit CCD provides absolute calibration for HOPG Single events recorded at CCD plane Zoom Cu k- k- Histogram of single events = X-ray spectrum ~20% error in ccd efficiency CCD ~10% error in single event determination
An absolutely calibrated Bremsstrahlung spectrometer is used to measure the hot electron spectrum* Dosimeters (Image Plates or TLD’s) e- Pb + plastic housing • Sensitive from 10-400keV X-rays • Vacuum electron spectrometer removes charges particles from line of sight. • Sensitive from 0.1-4 MeV electrons** Collimator Electron Spectrometer *R. Nolte et al, Rad. Prot. Dosim., (1999); C. Chen, These proceedings (B3) **H. Chen These proceedings (D37)
e- h The hot electron spectrum is deconvolved from the bremsstrahlung spectrum using the Monte Carlo code ITS* Spectrometer Response matrix (modeled: ITS) Target Response matrix (modeled: ITS) Recorded signal … Fe Cu Pb Al Ti Deconvolved electron spectrum inside target 30° full angle 8m diam. source … … … IP 13 IP 1 IP 4 Vary I, T minimize SD vs dosimeters *C. Chen, These proceedings (B3)
A 1-T Boltzmann distribution provides a good fit to the measured data* One temperature fit: (1.3±0.15) MeV using ITS Monte Carlo model 8% conversion (~10J) to 1-3MeV electrons from ITS using Brem. 15% conversion to 1-3MeV electrons from ITS using absolute K- yield Estimate based on K- yield is more sensitive to lower energy electrons 121J, 1020Wcm-2 Non-refluxing Cu foil target MeV/mm2 Dosimeter layer • Next step: 2 Temperature fit, hybrid PIC simulations to include ohmic potentials, return currents, resistivity • conversion efficiency may drop *C. Chen, These proceedings (B3)
This 1 temperature analysis using ITS shows that Thot scales with intensity at a lower rate than suggested by pondermotive scaling • Pondermotive scaling: • Thot(MeV)= (I2/(1019W/cm2m2))1/2 • Beg scaling: • Thot(MeV)= 0.1(I 2/(1017W/cm2m2))1/3
Summary • On shot laser diagnostics are crucial for benchmarking simulations: • Interferometry agrees with 2D hydro for foil targets using the measured pre-pulse • Equivalent Plane imaging demonstrates consistent intensity distribution between the Titan alignment beam and full system shots • The 1-T hot electron spectrum analysis shows less than pondermotive scaling • We need to include hybrid PIC simulations and a 2-T model to better understand both conversion efficiency and the electron energy spectrum
CD Target Gold coated cylindrical mirror Harada grating Front (plume) Rear (surface) XUV spectroscopy measurements give a lower bound on black body imaging results* 45° Measured line ratios agree with synthetic spectra at given T, Intensity ratio *Tammy Ma, These proceedings (B15)
Bremsstrahlung analysis Target response matrix: ITS 150 photon energy bins ×80 electron energy bins Cannon response matrix: ITS 13 Image Plate Layers × 150 photon energy bins Energy per photon deposited in each IP Number of photons generated per e- Electron spectrum: 80 electron energy bins Image plate signal: 13 dosimeter readings 1-1.1 keV 92-100 MeV 89-100 MeV 0-5 keV . . . . . . T1,80 D1 T1,3 ... C1,150 N1 T1,2 C1,3 T1,1 1 ... 1-1.1 keV C1,2 C1,1 T2,2 T2,1 2 C2,2 D2 C2,1 N2 ... ... × = × T3,1 3 ... C3,1 D3 ... ... N3 ... ... . . . ... ... ... ... ... ... ... . . . ... ... ... D13 T150,1 T150,80 ... ... ... N80 92-100 MeV C13,1 C13,150 13 Vary I, T minimize SD vs dosimeters
Absolute yield depends on target and laser configuration Cones have the highest yield multiple pass-refluxing Single pass Oblique incidence *K. Akli, GA, These proceedings
XUV and K- imaging are used to measure coupling and transport in cones S Baton LULI, LVW OSU POP Ray-trace aberrated Titan beam 68eV XUV channel ~155mm 800mm defocus k-a peak ~8keV Cu K-a channel ~100mm tight and 400mm defocus k-a peak ~140mm to tip nc at ~40mm(from hydro) 400mm defocus ~0.4MeV Tight focus at tip Best focus ~1.1MeV ~200mm to tip 800mm defocus ~0.25MeV Focus Up-stream 400mm ~180mm to tip Focus Down-stream 400mm Foil Cone: • Thot: ~1MeV 1.1MeV • k-a yield: 7x10⁹ Ph/J/Sr 2.5x10¹⁰ Ph/J/Sr Efficiency ~50% ~180mm to tip Focus Down-stream 800mm XUV poster GP8.00065: Tammy Ma