Download
1 / 17
170 likes | 285 Views
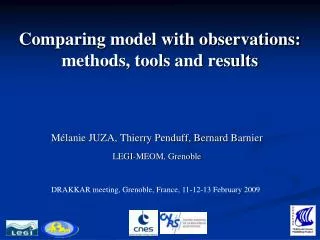
Comparing model with observations: methods, tools and results. Mélanie JUZA, Thierry Penduff, Bernard Barnier LEGI-MEOM, Grenoble. DRAKKAR meeting, Grenoble, France, 11-12-13 February 2009. Objectives / Activities. Global Drakkar simulations: G70 (DFS3 forcing): ¼°, ½°, 1°, 2°.

E N D
Comparing model with observations:methods, tools and results Mélanie JUZA, Thierry Penduff, Bernard Barnier LEGI-MEOM, Grenoble DRAKKAR meeting, Grenoble, France, 11-12-13 February 2009
Objectives / Activities Global Drakkar simulations: G70 (DFS3 forcing): ¼°, ½°, 1°, 2° • Observations: T/S profiles (ENACT-ENSEMBLES), SLA (AVISO), SST (Reynolds) • Assessment of DRAKKAR simulations • - Quantitative and systematic comparisons model/observations • - Intercomparison of simulations • (impact of resolution, forcing, numerical scheme, parametrizations) • Observability of the ocean dynamics (OSSE) • - Accuracy of ARGO array • Distribution of data and tools to the scientific community • Development of tools: collocation model/observations, statistics, vizualization • Scientific studies. Papers in preparation…
Hydrography: collocation ENACT/ENSEMBLES (ARGO, XBT, CTD, buoys) T,S(x,y,z,t) profiles (~8.106) Global. 1956-2006 MODEL T,S(x,y,z,t) Global. 1958-2007 • Keep good data only • Quadrilinear collocation (obs. space) SAMPLING ERROR VALIDATION COLLOCATED OBSERVED and MODEL T,S(x,y,z,t) profiles Dispersed in time and space Temporal, spatial, vertical (mixed layer) integrations Statistical analysis
Hydrography: collocation ENACT/ENSEMBLES (ARGO, XBT, CTD, buoys) T,S(x,y,z,t) profiles (~8.106) Global. 1956-2006 MODEL T,S(x,y,z,t) Global. 1958-2007 • Keep good data only • Quadrilinear collocation (obs. space) SAMPLING ERROR VALIDATION COLLOCATED OBSERVED and MODEL T,S(x,y,z,t) profiles Dispersed in time and space Temporal, spatial, vertical (mixed layer) integrations Statistical analysis ARGO 1998-2004
Hydrography: simulated and observed MLD August 1998-2004 February 1998-2004 Mixed layer depths (MLD) (m) ARGO ORCA025-G70 Realism of simulated and observed MLD
Hydrography: method for the analysis of mixed layer quantities 83% Median 17% • Distribution of Mixed Layer Depth / Temperature / Salinity / Heat and Salt Contents • Medians and percentiles 17% and 83% Exemple: MLD in North Atlantic September 1998-2004 SAMPLING ERROR MODEL BIAS -- full model -- subsampled model (like ARGO) -- ARGO
Hydrography: sampling errors Monthly cycles of MLD (1998-2004): zone MNW-ATL -- subsampled model (ARGO) -- full model MLD Solid lines = medians Dashed lines = percentiles 17%, 83% Sampling error well observed monthly cycle. Sampling error in winter.
Hydrography: sampling errors at global scale MLD too shallow too deep ARGO sampling errors on the monthly MLD (1998-2004) Sampling error = <subsampled model > – <full model> Bins = 30° x 30° x 1 month (1998-2004) • ARGO sampling errors maximum in winter (extreme values ~100m) • Especially in inhomogene (Southern Ocean, North Atl.) and coastal regions
Hydrography: sampling errors at global scale MLD too shallow too deep ARGO sampling errors on the monthly MLD (1998-2004) Sampling error = <subsampled model > – <full model> Bins = 30° x 30° x 1 month (1998-2004) • ARGO sampling errors maximum in winter (extreme values ~100m) • Especially in inhomogene (Southern Ocean, North Atl.) and coastal regions
Hydrography: sampling errors at global scale MLD too shallow too deep ARGO sampling errors on the monthly MLD (1998-2004) Sampling error = <subsampled model > – <full model> Bins = 30° x 30° x 1 month (1998-2004) • ARGO sampling errors maximum in winter (extreme values ~100m) • Especially in high variable (Southern Ocean, North Atl.) and coastal regions
Hydrography: sampling errors at global scale MLD too shallow too deep ARGO sampling errors on the monthly MLD (1998-2004) Sampling error = <subsampled model > – <full model> Bins = 30° x 30° x 1 month (1998-2004) • ARGO sampling errors maximum in winter (extreme values ~100m) • Especially in high variable (Southern Ocean, North Atl.) and coastal regions
Hydrography: conclusion • Assessment of ARGO sampling errors • - More dependence on spatial distribution of floats rather than number of floats • - MLT, MLS, MLHC, MLSC • Assessment of the simulations • - Mixed layer monthly cycles • - Impact of resolution • Perspectives • Extension to: - recent years (maximum ARGO coverage) • - the last 50 years (interannual cycles) • - all instruments (ARGO floats + CTD, XBT, moored buoys…)
Altimetry: collocation AVISO altimeter SLA(x,y,t) database Quasiglobal. 1993-2004 MODEL SSH(x,y,t) Global. 1958-2007 Quantitative Assessment Variances, Correlations, EOFs, etc FILTERED MODEL and AVISO SLA(x,y,t) 1993-2004 • Trilinear collocation on 1/3°x1/3°x7day AVISO Maps • Mask AVISO under MODEL Ice • Mask MODEL under AVISO Ice • Linear detrending • Remove 1993-1999 means • Remove spatial averages Space-Time Lanczos Filtering Annual Hi-freq Inter annual Space COLLOCATED MODEL and AVISO SLA(x,y,t) Large- scale 6° Regional & mesoscale 18 months 5 months Time
Altimetry: interannual SLA (statistics) SLA standard deviation Model/obs SLA correlation => Forced vs intrinsic variability in the Southern Ocean Impact of resolution on low-frequency variability SLA standard deviation (cm) (1993-2004) AVISO ¼°: ORCA025-G70 ½°: ORCA05-G70.113 1°: ORCA1-R70 2°: ORCA246-G70 Global increase of interannual variability with resolution Interannual variability increases in eddy-active regions Correlation decreases with resolution in S.O.
Altimetry: interannual variability (EOFS) Assess the ability of models to reproduce the observed interannual variability in various regions • Data processing • - Observed SLA EOFs (decomposition: spatial mode + temporal amplitude-PC) • Projection of simulated SLA on observed SLA EOFS • Comparison PC(obs)/projections: % variance, correlation Exemple: interannual SLA in North Atlantic (1993-2004) Mode 1 – Observed SLA – %var=17 Associated obs. amplitude and mod. projections Lag with NAO (weeks) obs¼° ½° 1° 2° Projections of simulated SLA reproduce main features of the obs. variability. More explained variance with 1/4° Simulated lags more realistic with increase of resolution Intergyre gyre of Marshall Resolution improves space-time variability
Altimetry: interannual variability (EOFS) Exemple: large-scale (>6°) and interannual SLA in Southern Ocean (1993-2004) Mode 1 – Observed SLA – %var=18 Associated obs. amplitude and mod. projections Response to ENSO Resolution does not change variance projected on observations Conclusion: - Global and regional (North Atl., Gulf Stream, Equat. Pac., Indian, Southern Ocean) - Resolution improves space-time variability, except in Southern Ocean (intrinsic variability?) - Similar processing applied to SST analysis (Reynolds, NCEP) - Response of ocean to atmospheric variability (NAO, ENSO, SAM, AAO…) - Impact of mesoscale on low-frequency variability
Conclusion • Collocate and compare model & observations: T, S, SLA, SST • Assess simulations. Quantify model sensitivities • Evaluate the accuracy of observing systems (ARGO sampling errors, paper in preparation) • Tools are mature. Technical report & users manual. Fields are being distributed. • Perspectives • Further assess the interannual variability in eddying models (paper in preparation) • Evaluate every new simulation (global, regional, reanalyses) • Extend to new datasets: current meters (G. Holloway), ice field thickness (A. Worby), • gravimetry, maregraph, SSS, … • Foster collaborations http://www-meom.hmg.inpg.fr/Web/pages-perso/MelanieJuza/