Download
1 / 11
110 likes | 198 Views
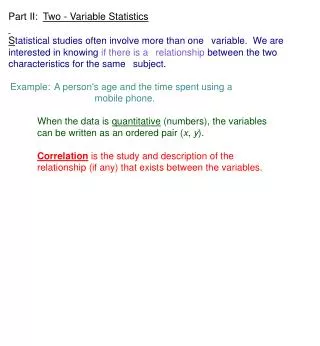
Explore the concepts of bivariate and partial correlations through graphical and algebraic views. Learn how to calculate correlation coefficients and shared variances using practical examples. Understand the impact of control variables on correlation relationships. Utilize SPSS for advanced analysis.

E N D
Two Variable Systems Bivariate and Partial Correlations
The Graphical View– A Scatter Diagram Y (WT) X’ . . . . . . . . . .. . . . . . .. . . . . . .. . . . .. . . .. . . . . Y’ A HIGH AND POSITIVE CORRLEATION X (HT)
The Graphical View– A Scatter Diagram Y (WT) X BAR X’ . .. . . . . . . . . . . .. .. . . . . . . .. . . . . . .. .. . . . . . .. . .. Y’ A HIGH AND NEGATIVE CORRLEATION Y BAR X (HT)
The Graphical View– A Scatter Diagram Y (WT) X’ . . . . . . . . . . . . . . . . . . . . . . . . . . . . . . . . . .. . . . . . . . .. .. . .. . .. . . . . . . . . . . . . . . . . . . Y’ NO CORRLEATION X (HT)
The Algebraic View – Shared Variance 1) Take the Variance in X = S2x and the Variance in Y = S2y 2) Then Average the Two Variances: 3) Find the Covariation Sxy : Where Sxy= r = 4) The correlation is simply 3) divided by 2): Hence r =
An Example of Calculating a Correlation 1) Find the raw scores, means, squared deviations and cross-products: X= M Educ Y=D Educ) ) 10 9 -4 -4 16 16 16 12 11 -2 -2 4 4 4 8 12 -6 -1 36 1 6 16 13 +2 0 4 0 0 18 16 +4 +3 16 9 12 20 17 +6 +4 36 16 24 14 13 112 46 62 2) Calculate the correlation: r = = .864 3) Square r to determine variation explained r2 = .746
.55 – (.6) (.4) The Partial Correlation Coefficient Step 1 – Determine the zero order Pearson’s correlations (r). Assume rxy= .55 where x = divorce rate and y = suicide rates. Further, assume unemployment rate (z) is our control variable and that rxz= .60 and ryz= .40 Step 2 – Calculate the partial correlation (rxy.z) = = .42 Therefore, Z accounts for (.30-.18) or 12% of Y and (.12/.30) or 40% of the relationship between X&Y Before z (rxy)2 = .30 Step 3 – Draw conclusions After z (rxy.z)2 = .18
Using SPSS for finding Partial Correlation Coefficients INPUT
Using SPSS for finding Partial Correlation Coefficients OUTPUT