Download
1 / 18
180 likes | 274 Views
Part II: Two - Variable Statistics S tatistical studies often involve more than one variable. We are interested in knowing if there is a relationship between the two characteristics for the same subject. Example: A person's age and the time spent using a mobile phone.

E N D
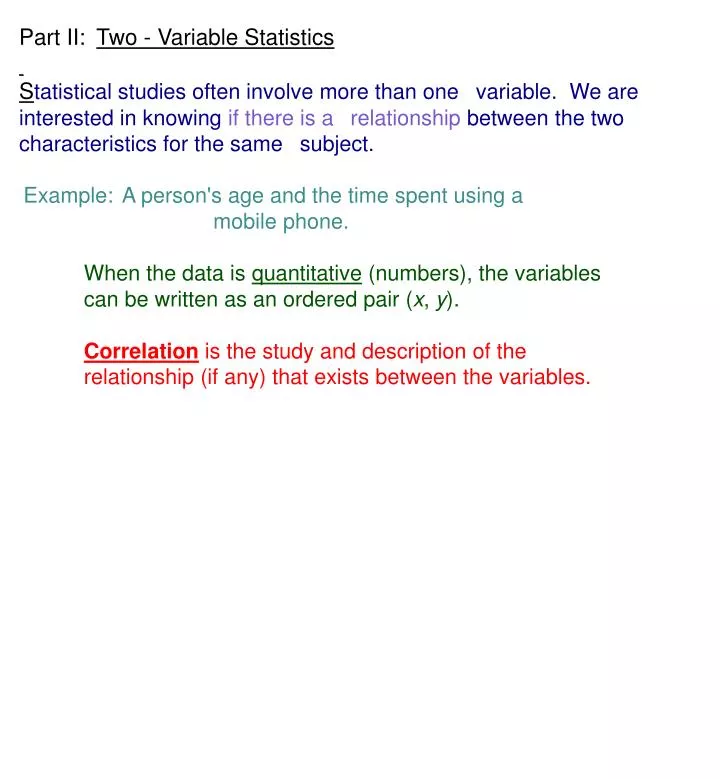
Part II: Two - Variable Statistics Statistical studies often involve more than one variable. We are interested in knowing if there is a relationship between the two characteristics for the same subject. Example: A person's age and the time spent using a mobile phone. When the data is quantitative (numbers), the variables can be written as an ordered pair (x, y). Correlation is the study and description of the relationship (if any) that exists between the variables.
A) Qualitative Interpretation of Correlation Data can be organised and displayed in a scatterplot (Cartesian plane) or a contingency table. By inspection, we will describe the type, the direction, and the intensity (or strength) of the relation between the variables.
Type: Refers to the function that best fits the relation between the variables. We will be using linear correlation. Direction: If both variables move in the same direction (increase together or decrease together), then the direction ispositive. If both variables move in opposite directions, then direction isnegative. Intensity: Strength may be categorised as... Zero,weak,moderate,strongorperfect.
Example: In a gym class students were required to do push-ups and sit-ups. Each student's achievements were recorded as an ordered pair. The first number refers to push-ups and the second to sit-ups. (27, 30), (26, 28), (38, 45), (52, 55), (35, 36), (40, 54), (40, 50), (52, 46), (42, 55), (61, 62), (35, 38), (45, 53), (38, 42), (63, 55), (55, 54), (46, 46), (34, 36), (45, 45), (30, 34), (68, 62)
Contingency Table - A table of values (often involves classes) - Listed down the left side is one variable; listed across the top is the other variable. - Each row and column is added and the totals are displayed; the bottom right cell shows the total frequency of the distribution.
(27, 30), (26, 28), (38, 45), (52, 55), (35, 36), (40, 54), (40, 50), (52, 46), (42, 55), (61, 62), (35, 38), (45, 53), (38, 42), (63, 55), (55, 54), (46, 46), (34, 36), (45, 45), (30, 34), (68, 62)
When the majority of the values fall into a diagonal of a contingency table, and the corners contain mostly zeros, then the correlation is said to be linear and strong. Direction is positive if the diagonal is Direction is negative if the diagonal is
Scatterplot - A Cartesian graph - Each ordered pair is represented as a point (27, 30), (26, 28), (38, 45), (52, 55), (35, 36), (40, 54), (40, 50), (52, 46), (42, 55), (61, 62), (35, 38), (45, 53), (38, 42), (63, 55), (55, 54), (46, 46), (34, 36), (45, 45), (30, 34), (68, 62)
B) Quantitative Interpretation of Correlation The correlation will be represented by a number, called thecorrelation coefficient. This coefficient will range from to . Its symbol is r.
1) Draw a scatterplot 2) Draw a line that "best fits" the points. This line passes through the middle of the scatterplot. 3) Around the points, draw the smallestrectangle possible. Two of the sides should be parallel to the line. 4) Measure the dimensions of the rectangle. (27, 30), (26, 28), (38, 45), (52, 55), (35, 36), (40, 54), (40, 50), (52, 46), (42, 55), (61, 62), (35, 38), (45, 53), (38, 42), (63, 55), (55, 54), (46, 46), (34, 36), (45, 45), (30, 34), (68, 62)
5) Calculate the correlation coefficient, r. + if it's increasing, if it's decreasing ( ) r = + 1 - 2.4 7.9 r = +(1- 0.3) r = 0.7 moderate real r= 0.87
The Regression Line Also called a line of best fit, a regression line is one that bestrepresents (or passes through) the points of a scatterplot. It passes through as many points as possible, going through the middle of the scatterplot. There are several different methods of drawing a regression line. The regression line may be used to predict values that do not appear in the distribution.
Using the regression line, we can predict the value of one variable, given the value of the other. The reliability of the prediction depends on the strength of the correlation. Examples: a) Predict the number of b) Predict the number ofsit-ups a student canpush-ups a student cando if he can do 49do if she can do 70push-ups. sit-ups. Determine the equation of the line.
Recall: Since the correlation is moderate/high, we can be confident that our predictions are good. predicted actual
Interpreting a Correlation A strong correlation indicates that there is a statistical relationship between two variables. It does not, however, explain the reason for the relationship or its nature. There are other things to consider...
The outlier any point that stands alone away from the group is left outide the rectangle. DON'T INCLUDE THIS POINT IN THE RECTANGLE OUTLIER Is there a strong correlation? What is the correlation coefficient? What would be the value of y when x = 2? Make a prediction what is the equation for the line of best fit?