Download
1 / 13
170 likes | 367 Views
Two Variable Tables. February 23, 2011. Objectives. By the end of this meeting, participants should be able to: Create and interpret a cross-tabulation using frequency and percentage tables. Explain the considerations related to missing data in a cross-tabulation. Cross Tabs.

E N D
Two Variable Tables February 23, 2011
Objectives By the end of this meeting, participants should be able to: Create and interpret a cross-tabulation using frequency and percentage tables. Explain the considerations related to missing data in a cross-tabulation.
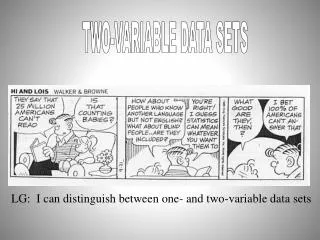
Cross Tabs • A popular and useful way to study the relationship between two ordinal or nominal variables is through a bivariate frequency distribution. • This is also called a contingency table, cross-tabulation and more commonly cross tabs. • These tables can be computed as percentages or counts
Count Tables • Tables that use simply a count of two variables are generally less useful because of the ease of confusion. • A fictional example:
Count Tables • Which professor’s class are you more likely to fail ? • On a quick glance you might think that Smith was the harder of two professors failing 19 students with a D or an F. • But Smith issued a D or an F in 22.5% cases while Jones issued a D or an F 30% of the time. • So if you want to be safe, Smith is the better choice.
Count Tables • A real example: Lincoln County, MO is traditionally a bellwether in presidential elections. Look at the 2008 results from this county: • Based upon this count it would be easy to conclude that the county had near-unanimous support for McCain. Instead, while the county went for McCain it did so by 2,690 votes, or 11.6% of the 23,158 cast.
Percentage Tables • Due to the ease of confusion with count tables most analysts lean more towards to percentage tables. • These tables make it easier for the reader to observe the relationship between two variables. • The best percentage tables should have some basic count information on them, such as total number of cases.
Percentage Tables • Without some basic count information is still easy for the reader to be misled. • For example, lets examine the Missouri Congressional District 5 in 2008 which includes all of Kansas City, MO and parts of Jackson and Cass counties. Let’s say that our question was did the vote vary in this district by county?
Percentage Tables • So from this table we see that there is substantial variation in District 5 by county. The problem is we cannot answer the more basic question of who won that election.
Percentage Tables • This table can be improved by adding some simple count information so that the final result is clear. How would we explain the differences in vote by county?
Missing Data • In the previous example we were using the official results from the MO Secretary of State and we had access to full results. Therefore, we did not have to deal with the issue of missing data. • Generally, whenever using survey data there is always the question of missing data. • Some missing data comes from errors or omissions while others stem from refusals.
Missing Data • When presenting data as a table the analyst needs to decide how they want to present these categories. • Generally it is necessary to determine how important the missing cases are to the analysis.
For Next Time • Read WKB chapter 12 • Select two ordinal variables with a possible relationship from the PS-ARE data. • Recode the variables (if necessary) so that they are both ordinal scales. • Compute the cross tabulation of the two variables with both frequencies and percentages. • Interpret this table. Are the variables substantively associated? • Hint: Save the code you used to get this table. It’ll come in handy for your next homework.