Download
1 / 1
10 likes | 73 Views
50 100 150 200 250. 1 2 3 4 5. A few CDR processing considerations….

E N D
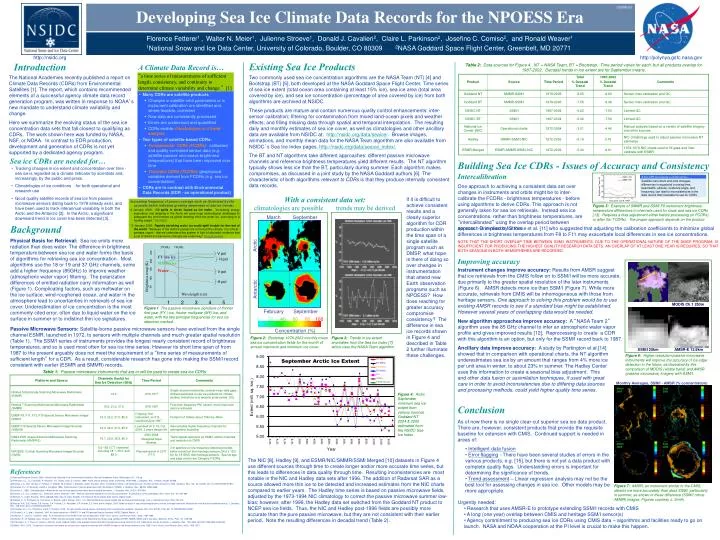
50 100 150 200 250 1 2 3 4 5 A few CDR processing considerations….. Satellite instrument and orbit changes, differences in equatorial crossing time, beamwidth, altitude, incidence angle, and frequency, can lead to inconsistencies in the data record that invalidate its use for CDRs March September Arctic 37GHz 19GHz V pol FY sea ice H pol MY sea ice Water V pol Brightness temp (K) Antarctic H pol Wavelength (cm) MODIS Ch.1 250m February September 0 20 40 60 80 100 Concentration (%) SSM/I 25km AMSR-E 12.5km Monthly Averages, SSM/I - AMSR (% concentration) March 2005 Sept 2005 March 2005 Sept 2005 OS35B-03 Developing Sea Ice Climate Data Records for the NPOESS Era Florence Fetterer1 , Walter N. Meier1, Julienne Stroeve1, Donald J. Cavalieri2, Claire L. Parkinson2, Josefino C. Comiso2, and Ronald Weaver1 1National Snow and Ice Data Center, University of Colorado, Boulder, CO 80309 2NASA Goddard Space Flight Center, Greenbelt, MD 20771 http://nsidc.org http://polynya.gsfc.nasa.gov Existing Sea Ice Products Introduction Table 2: Data sources for Figure 4. NT = NASA Team, BT = Bootstrap. Time period varies for each, but all products overlap for 1987-2002. Decadal trends in ice extent are for September means. A Climate Data Record is… “a time series of measurements of sufficient length, consistency, and continuity to determine climate variability and change.” [1] The National Academies recently published a report on Climate Data Records (CDRs) from Environmental Satellites [1]. The report, which contains recommended elements of a successful agency climate data record generation program, was written in response to NOAA’s new mandate to understand climate variability and change. Here we summarize the evolving status of the sea ice concentration data sets that fall closest to qualifying as CDRs. The work shown here was funded by NASA, NSF, or NOAA. In contrast to EDR production, development and generation of CDRs is not yet supported by a dedicated agency program. Two commonly used sea ice concentration algorithms are the NASA Team (NT) [4] and Bootstrap (BT) [5], both developed at the NASA Goddard Space Flight Center. Time series of sea ice extent (total ocean area containing at least 15% ice), sea ice area (total area covered by ice), and sea ice concentration (percentage of area covered by ice) from both algorithms are archived at NSIDC. These products are mature and contain numerous quality control enhancements: inter-sensor calibration; filtering for contamination from mixed land-ocean pixels and weather effects; and filling missing data through spatial and temporal interpolation. The resulting daily and monthly estimates of sea ice cover, as well as climatologies and other ancillary data are available from NSIDC at: http://nsidc.org/data/seaice/. Browse images, animations, and monthly mean data for the NASA Team algorithm are also available from NSIDC’s Sea Ice Index pages, http://nsidc.org/data/seaice_index/. The BT and NT algorithms take different approaches: different passive microwave channels and reference brightness temperatures yield different results. The NT algorithm typically shows less ice than the BT, particularly during summer. Each algorithm makes compromises, as discussed in a joint study by the NASA Goddard authors [6]. The characteristic of both algorithms relevant to CDRs is that they produce internally consistent data records. • Many CDRs are satellite products • Changes in satellite orbit parameters or in instrument calibration are identified and, where feasible, corrected • Raw data are consistently processed • Errors are understood and quantified • CDRs enable climatologies and trend analysis • Two types of satellite-based CDRs: • Fundamental CDRs (FCDRs): calibrated and quality-controlled sensor data (e.g. satellite passive microwave brightness temperatures) that have been improved over time • Thematic CDRs (TCDRs): geophysical variables derived from FCDRs (e.g. sea ice concentration) • CDRs are in contrast with Environmental Data Records (EDR - an operational product) Sea ice CDRs are needed for… Building Sea Ice CDRs - Issues of Accuracy and Consistency • Tracking changes in ice extent and concentration over time - sea ice is regarded as a climate indicator by scientists and, increasingly, by the public and press. • Climatologies of ice conditions - for both operational and research use • Good quality satellite records of sea ice from passive microwave sensors dating back to 1978 already exist, and have been used to track interannual variability in both the Arctic and the Antarctic [2]. In the Arctic, a significant downward trend in ice cover has been detected [3]. Intercalibration One approach to achieving a consistent data set over changes in instruments and orbits might be to inter-calibrate the FCDRs - brightness temperatures - before using algorithms to derive CDRs. This approach is not generally taken for sea ice retrievals. Instead sea ice concentrations, rather than brightness temperatures, are “intercalibrated” using the overlap period between sensors. One reason for this Brightness Temp (K) With a consistent data set: If it is difficult to achieve consistent results and a clearly superior algorithm for CDR production within the time span of a single satellite program such as DMSP, what hope is there of doing so over changes in instrumentation that attend new Earth observation programs such as NPOESS? How does reaching for greater accuracy compromise consistency? The difference in sea ice records shown in Figure 4 and described in Table 2 further illuminate these challenges. Increasing frequency of press coverage such as illustrated by the excerpts below indicates growing awareness of sea ice trends: Days past July 9, 1987 Figure 5: Example of SMMR and SSMI F8 instrument brightness temperature differences in channels used for snow and sea ice CDRs [13]. Requires a bias adjustment either before processing (in FCDRs) or after (for TCDRs). The proper approach depends on the product. climatologies are possible trends may be derived 4 January 2006: Oil spills in Arctic feared as ice melts "Increasing energy exploration and shipping in the Arctic will pose huge technological challenges to safeguard the environment as global warming thins the polar ice, according to a leading expert." (MSNBC) 10 January 2006: Rapidly shrinking arctic ice could spell trouble for the rest of the world "Because of the Arctic's pivotal role in the Earth's climate, it is critical - perhaps urgent - that we understand this system in light of abundant evidence that a set of linked and pervasive changes are under way." (Knight-Ridder) Background approach is implied by Stroeve et al. [11] who suggested that adjusting the calibration coefficients to minimize global differences in brightness temperatures from F8 to F11 may exacerbate local differences in sea ice concentrations. NOTE THAT THE SHORT OVERLAP TIME BETWEEN SSM/I INSTRUMENTS, DUE TO THE OPERATIONAL NATURE OF THE DMSP PROGRAM, IS INSUFFICIENT FOR PRODUCING THE HIGHEST QUALITY RESEARCH DATA SETS. AN OVERLAP OF AT LEAST ONE YEAR IS REQUIRED, SO THAT BOTH SEASONS IN BOTH HEMISPHERES ARE RECORDED. Physical Basis for Retrieval: Sea ice emits more radiation than does water. The difference in brightness temperature between sea ice and water forms the basis of algorithms for retrieving sea ice concentration. Most algorithms use the 18 or 19 and 37 GHz channels, some add a higher frequency (85GHz) to improve weather (atmospheric water vapor) filtering. The polarization differences of emitted radiation carry information as well (Figure 1). Complicating factors, such as meltwater on the ice surface, wind-roughened ocean, and water in the atmosphere lead to uncertainties in retrievals of sea ice cover. Underestimation of ice concentration is the most commonly cited error, often due to liquid water on the ice surface in summer or to indistinct thin ice signatures. Improving accuracy Instrument changes improve accuracy: Results from AMSR suggest that ice retrievals from the CMIS follow on to SSM/I will be more accurate, due primarily to the greater spatial resolution of the later instruments (Figure 6). AMSR detects more ice than SSM/I (Figure 7). While more accurate, retrievals from CMIS will be inhomogeneous with those from heritage sensors. One approach to solving this problem would be to use existing AMSR records to see if a standard bias might be established. However several years of overlapping data would be needed. New algorithm approaches improve accuracy: A “NASA Team 2” algorithm uses the 85 GHz channel to infer an atmospheric water vapor profile and gives improved results [12]. Reprocessing to create a CDR with this algorithm is an option, but only for the SSM/I record back to 1987. Ancillary data improve accuracy: A study by Partington et al.[14] Figure 1 The passive microwave signature of thinner first year (FY ) ice, thicker multiyear (MY) ice, and water, with the two principal frequencies for sea ice detection marked. Passive Microwave Sensors: Satellite-borne passive microwave sensors have evolved from the single channel ESMR, launched in 1972, to sensors with multiple channels and much greater spatial resolution (Table 1). The SSM/I series of instruments provides the longest nearly consistent record of brightness temperatures, and so is used most often for sea ice time series. However its short time span of from 1987 to the present arguably does not meet the requirement of a “time series of measurements of sufficient length” for a CDR. As a result, considerable research has gone into making the SSM/I record consistent with earlier (ESMR and SMMR) records. Figure 2: Bootstrap 1978-2003 monthly mean sea ice concentration fields for the month of annual maximum and minimum ice cover. Figure 3: Trends in ice extent anomalies from the Sea Ice Index [7], which uses the NASA Team algorithm showed that in comparison with operational charts, the NT algorithm underestimates sea ice by an amount that ranges from 4% more ice per unit area in winter, to about 23% in summer. The Hadley Center uses this information to create a seasonal bias adjustment. This and other data fusion or assimilation techniques, if used with great care in order to avoid inconsistencies due to differing data sources and processing methods, could yield higher quality time series. Figure 6: Higher resolution passive microwave instruments will improve the accuracy of ice edge detection in the future, as illustrated by this comparison of MODIS (visible band) and AMSR (passive microwave) imagery with SSM/I. September Arctic Ice Extent Table 1: Passive microwave instruments that are or will be used to create sea ice CDRs Figure 4: Arctic September minimum sea ice extent from various sources. Goddard NT 2004 & 2005 estimated from the NSIDC Sea Ice Index. • Conclusion • As of now there is no single clear-cut superior sea ice data product. There are, however, consistent products that provide the requisite baseline for extension with CMIS. Continued support is needed in areas of: • Intelligent data fusion • Error flagging - There have been several studies of errors in the various products, e.g. [15], but there is not yet a data product with complete quality flags. Understanding errors is important for determining the significance of trends. • Trend assessment – Linear regression analysis may not be the best tool for assessing changes in sea ice. Other models may be more appropriate. The NIC [8], Hadley [9], and ESMR/NIC/SMMR/SSMI Merged [10] datasets in Figure 4 use different sources through time to create longer and/or more accurate time series, but this leads to differences in data quality through time. Resulting inconsistencies are most notable in the NIC and Hadley data sets after 1996. The addition of Radarsat SAR as a source allowed more thin ice to be detected and increased estimates from the NIC charts compared to earlier years. The Hadley time series is based on passive microwave fields, adjusted by the 1973-1994 NIC climatology to correct the passive microwave summer low-bias; however, after 1996, the Hadley data set switched from the Goddard NT product to NCEP sea ice fields. Thus, the NIC and Hadley post-1996 fields are possibly more accurate than the pure passive microwave, but they are not consistent with their earlier period. Note the resulting differences in decadal trend (Table 2). References [1] National Research Council, 2004. Climate Data Records from Environmental Satellites. National Academies Press, Washington, DC. 116 pp. [2] Parkinson, C.L., D.J. Cavalieri, P. Gloersen, H.J. Zwally, and J.C. Comiso, 1999. Arctic sea ice extents, areas, and trends, 1978-1996, J. Geophys. Res., 104(C9), 20,837-20,856. [3] Stroeve, J.C., M.C. Serreze, F. Fetterer, T. Arbetter, W.N. Meier, J. Maslanik, and K. Knowles, 2005. Tracking the Arctic’s shrinking ice cover: Another extreme minimum in 2004, Geophys. Res. Lett., 32, L04501, doi: 10.1029/2004GL021810. [4] Cavalieri, D.J., P. Gloersen, and W.J. Campbell, 1984. Determination of sea ice parameters with the Nimbus 7 SMMR, J. Geophys. Res., 89(C3), 5355-5369. [5] Comiso, J., 1986. Characteristics of Arctic winter sea-ice from passive microwave and infrared observations, J. Geophys. Res., 91(C1), 975-994. [6] Comiso, J.C., D.J. Cavalieri, C.L. Parkinson, and P. Gloersen, 1997. Passive microwave algorithms for sea ice concentration: A comparison of two techniques, Rem. Sens. Env., 60, 357-384. [7] Fetterer, F., and K. Knowles. 2002, updated 2004. Sea ice index. Boulder, CO: National Snow and Ice Data Center. Digital media. [8] Dedrick, K., K. Partington, M. Van Woert, C. Bertoia, and D. Benner, 2001. U.S. National/Naval Ice Center Digital Sea Ice Data and Climatology, Can. J. Remote Sensing, 27(5), 457-475. [9] Rayner, N.A., D.E. Parker, E.B. Horton, C.K. Folland, L.V. Alexander, D.P. Rowell, E.C. Kent, and A. Kaplan. 2003. Global analysis of sea surface temperature, sea ice, and night marine air temperature since the late nineteenth century. J. Geophys. Res., 108 (D14). doi:10.1029/2002JD002670. [10] Cavalieri, D.J., C.L. Parkinson, and K.Y. Vinnikov, 2003. 30-year satellite record reveals contrasting Arctic and Antarctic variability, Geophys. Res. Lett., 30(18), 1970, doi: 10.1029/2003GL018031. [11] Stroeve,J. X. Li and J. Maslanik. 1997. An Intercomparison of DMSP F11-and F13-derived Sea Ice Products. NSIDC Special Report - 5. [12] Markus, T., and D.J. Cavalieri, 2000. An enhancement of the NASA Team sea ice algorithm, IEEE Trans. Geosci. and Remote Sens., 38(3), 1387-1398. [13] Steffen, K., W. Abdalati and J. Stroeve. (1993), Climate sensitivity studies of the Greenland Ice Sheet using satellite AVHRR, SMMR, SSM/I and in situ data., Meteorol. Atmos. Phys., 51, 239-258. [14] Partington, K., T. Flynn, D. Lamb, C. Bertoia, and K. Dedrick (2003), Late twentieth century Northern Hemisphere sea-ice record from U.S. National Ice Center ice charts, J. Geophys. Res., 108, 3343, doi:3310.1029/2002JC001623. [15] Meier, W.N., 2005. Comparison of passive microwave ice concentration algorithm retrievals with AVHRR imagery in the Arctic peripheral seas, IEEE Trans. Geosci. and Remote Sens., 43(6), 1324-1337. Figure 7: AMSR, an instrument similar to the CMIS, detects ice more accurately than does SSMI, particularly in summer, as shown in these difference (SSM/I minus AMSR) images. Figures courtesy J. Smith. • Urgently needed: • Research that uses AMSR-E to prototype extending SSM/I records with CMIS • A long (one year) overlap between CMIS and heritage SSM/I sensor(s) • Agency commitment to producing sea ice CDRs using CMIS data – algorithms and facilities ready to go on launch. NASA and NOAA cooperation at the PI level is crucial to make this happen.