Download
1 / 6
60 likes | 154 Views
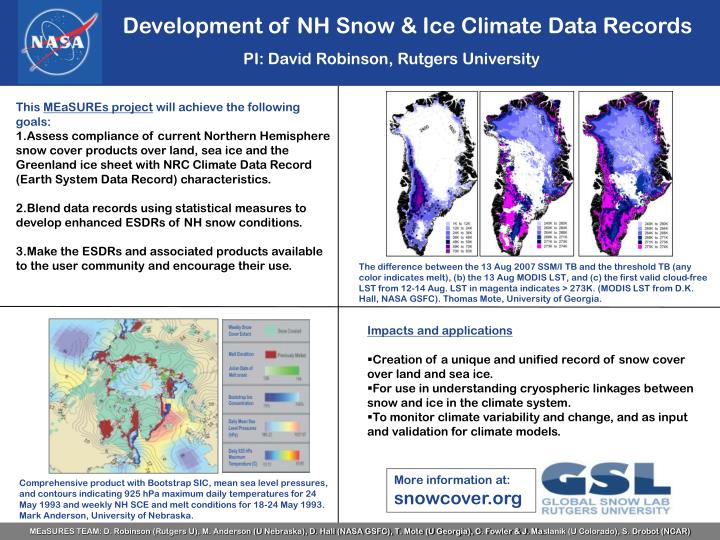
Development of NH Snow & Ice Climate Data Records. PI: David Robinson, Rutgers University. This MEaSUREs project will achieve the following goals:

E N D
Development of NH Snow & Ice Climate Data Records PI: David Robinson, Rutgers University • This MEaSUREs project will achieve the following goals: • Assess compliance of current Northern Hemisphere snow cover products over land, sea ice and the Greenland ice sheet with NRC Climate Data Record (Earth System Data Record) characteristics. • Blend data records using statistical measures to develop enhanced ESDRs of NH snow conditions. • Make the ESDRs and associated products available to the user community and encourage their use. The difference between the 13 Aug 2007 SSM/I TB and the threshold TB (any color indicates melt), (b) the 13 Aug MODIS LST, and (c) the first valid cloud-free LST from 12-14 Aug. LST in magenta indicates > 273K. (MODIS LST from D.K. Hall, NASA GSFC). Thomas Mote, University of Georgia. • Impacts and applications • Creation of a unique and unified record of snow cover over land and sea ice. • For use in understanding cryospheric linkages between snow and ice in the climate system. • To monitor climate variability and change, and as input and validation for climate models. More information at: snowcover.org Comprehensive product with Bootstrap SIC, mean sea level pressures, and contours indicating 925 hPa maximum daily temperatures for 24 May 1993 and weekly NH SCE and melt conditions for 18-24 May 1993. Mark Anderson, University of Nebraska. MEaSURES TEAM: D. Robinson (Rutgers U), M. Anderson (U Nebraska), D. Hall (NASA GSFC), T. Mote (U Georgia), C. Fowler & J. Maslanik (U Colorado), S. Drobot (NCAR)
Greenland Surface and Near-Surface Melt Extent Thomas Mote, University of Georgia MEaSUREs Project Development of NH Snow & Ice Climate Data Records (PI: David Robinson, Rutgers University) Satellite-derived maps of Greenland surface and near-surface melt from SSM/I and SMMR passive microwave data using a dynamic threshold algorithm Spatial extent of melt, melt frequency and melt duration have been upgraded to climate data record (CDR) quality Above: Melt extent in 2009 (x105 km2) (black), for 20 Jul 2009 (red) and average for 1979-2007 (green). Left: Observed minus threshold SSM/I 19H TB minus threshold TB for 20 Jul 2009 with melting areas indicated by symbols. Below: Total area experiencing melt in 2007 from SSM/I (cyan) and MODIS LST (>271K) (orange symbols) Relevance to NASA goals Provides a mature data record necessary for monitoring climate change at high latitudes Improves our understanding of the impact of climate change on the surface mass balance (SMB) of the Greenland ice sheet Further information contact: tmote@uga.edu website:snowcover.org Impacts and applications Greenland melt CDR shows increase in extent during 1979-2009 (peak in 2007), closely corresponding to hemispheric temperature records Records have been used in corroborating surface temperature records, selecting regions for ice core analysis, and interpreting atmospheric reanalysis products. 2007 total area of melt MEaSURES TEAM: D. Robinson (Rutgers U), M. Anderson (U Nebraska), D. Hall (NASA GSFC), T. Mote (U Georgia), C. Fowler & J. Maslanik (U Colorado), S. Drobot (NCAR)
Sea Ice Age Depicts Changes in Ice Cover Charles Fowler, University of Colorado • MEaSUREs Project • Satellite-derived data provide estimates of Arctic sea ice age, from 1- to 10-years old, in gridded format and graphics for 1979-present. • Contribution to NASA MEaSUREs . • Unique and direct evidence of fundamental changes in Arctic sea ice cover. Ice age maps for spring 1989 and 2009 showing large changes in age coverage • Impacts • Provides basic and clear indications of how the sea ice cover has changed since 1979. • Easily understandable forms and graphics that are effective at illustrating arctic change to the public. • Science Application • This work is relevant for analyses of sea ice trends, relationships to other parameters such as ice thickness and albedo, and model evaluation. • Relevance to NASA goals • Contributes to basic understanding of the Arctic climate system. • Used to help evaluate and improve sea ice and climate models. • Relevant for planning field operations such as ICEBridge. • Further information • contact: cfowler@colorado.edu • Website: snowcover.org MEaSURES TEAM: D. Robinson (Rutgers U), M. Anderson (U Nebraska), D. Hall (NASA GSFC), T. Mote (U Georgia), C. Fowler & J. Maslanik (U Colorado), S. Drobot (NCAR)
NH Visible Satellite Weekly Snow Extent Product PI: David Robinson, Rutgers University • MEaSUREs Project • Satellite-derived maps of NH snow cover extent (SCE) have been produced by NOAA meteorologists for over 40 years. • No other environmental variable has been mapped from satellite data in a generally consistent manner for such a long period. • Visible satellite-derived maps of Northern Hemisphere snow extent dating back to late 1966 have been upgraded to climate data (CDR) record quality. Northern Hemisphere SCE the week of March 17-23, 1998. Prior to daily IMS in May 1999, NOAA hand-drawn charts were digitized to a polar stereographic grid. New CDR • Impacts and applications • Hemispheric extent exhibits a stepwise decrease in the mid-1980s in addition to a downward trend in spring seasonal SCE. • For use in understanding cryospheric linkages between snow and ice in the climate system. • To monitor climate variability and change, and as input and validation for climate models. More information at: snowcover.org Mean SCE anomalies (in million sq. km) by continent for the period of record. Decadal average departures are shown in orange. Normals based on 1971-2000. Source: State of the Climate, BAMS 2009 Vol. 91. MEaSURES TEAM: D. Robinson (Rutgers U), M. Anderson (U Nebraska), D. Hall (NASA GSFC), T. Mote (U Georgia), C. Fowler & J. Maslanik (U Colorado), S. Drobot (NCAR)
MODIS Cloud-Gap-Filled Snow Cover Maps Dorothy K. Hall, Cryospheric Sciences Branch, NASA/GSFC • MEaSUREs Project • The Moderate-Resolution Imaging Spectroradiometer (MODIS) snow and ice project develops maps of global snow and sea ice extent and ice-surface temperature • Also supports NASA’s MEaSUREs Project (David Robinson, PI) and NOAA’s CDR Project (J. Key, PI) • MODIS cloud-gap-filled (CGF) snow algorithm provides a cloud-free daily snow map using a gap-filling technique Cloud-gap filled (CGF) cloud-persistence count (CPC) snow-cover map, 5 February 2008. The CPC provides quality information to the user regarding the snow-cover in each pixel or cell. • Relevance to NASA goals • MODIS CGF snow products contribute to improved understanding of global snow extent trends, 1966 – present. • Increases our understanding of the complex relationship between climate change and regional and hemispheric snow cover extent. • Further information • contact: dorothy.k.hall@nasa.gov • website:snowcover.org • Impacts of CGF maps on MeASUREs Snow Project • The removal of clouds from the daily MODIS snow-cover maps facilitates comparisons with the cloud-free Rutgers maps for production of a CDR • Science Application • The CGF maps are also for hydrologic studies such as the development of snow cover depletion curves for snowmelt-runoff modeling and streamflow prediction. MEaSURES TEAM: D. Robinson (Rutgers U), M. Anderson (U Nebraska), D. Hall (NASA GSFC), T. Mote (U Georgia), C. Fowler & J. Maslanik (U Colorado), S. Drobot (NCAR)
Spring 2010 Northern Hemisphere Snow Extent PI: David Robinson, Rutgers University NH SCE monthly anomaly map for May 2010 is shown (below, left). Negative departures from normal are indicated in brown, while positive anomalies are blue. • MEaSUREs Project • Event Summary, Spring 2010: • Saw the 4th lowest Northern Hemisphere snow cover extent (SCE) in 44 years. • North American spring SCE was the lowest on record. • Record low monthly snow extents in May over both Eurasia and North America contributed to the low spring SCE, resulting in the lowest May Northern Hemisphere SCE on record. Above shows May SCE anomalies from 1967-2010 with record low NH snow extent in May 2010. Spring SCE is calculated by averaging March, April and May values. • Impacts and applications • Record low April monthly SCE was also observed in North America this year, further contributing to the low spring SCE. • Rapid decline to low levels on the heels of a near record positive winter extent anomaly. • An attribution study is currently underway to explain such anomalous events. More information at: snowcover.org MEaSURES TEAM: D. Robinson (Rutgers U), M. Anderson (U Nebraska), D. Hall (NASA GSFC), T. Mote (U Georgia), C. Fowler & J. Maslanik (U Colorado), S. Drobot (NCAR)