Download
1 / 54
540 likes | 639 Views
Precipitation Verification of CAPS Real-time Forecasts During IHOP 2002. Ming Xue 1,2 and Jinzhong Min 1 Other contributors: Keith Brewster 1 Dan Weber 1 , Kevin Thomas 1 mxue@ou.edu 3/26/2003 Center for Analysis and Prediction of Storms (CAPS) 1 School of Meteorology 2 University of Oklahoma.

E N D
Precipitation Verification of CAPS Real-time Forecasts During IHOP 2002 Ming Xue1,2 and Jinzhong Min1Other contributors: Keith Brewster1 Dan Weber1, Kevin Thomas1mxue@ou.edu3/26/2003 Center for Analysis and Prediction of Storms (CAPS)1School of Meteorology2 University of Oklahoma
IHOP Related Research at CAPS • CAPS is supported through an NSF grant to • Contribute to the IHOP field experiment and • Perform research using data collected • Emphases of our work include • Optimal Assimilation and Qualitative assessment of the impact of water vapor and other high-resolution observations on storm-scale QPF.
Goals of CAPS Realtime Foreacst During IHOP • To provide additional high-resolution NWP support for the real time operations of IHOP • To obtain an initial assessment of numerical model performance for cases during this period • To identify data sets and cases for extensive retropective studies
CAPS Real Time Forecast Domain 183×163 273×195 213×131
ARPS Model Configuration • Nonhydrostatic dynamics with vertically-stretched terrain-following grid • Domain 20 km deep with 53 levels. • 3 ice-phase microphysics (Lin-Tao) • New Kain-Fritsch cumulus parameterization on 27 and 9 km grids • NCSA Long and Short Wave Radiative Transfer scheme • 1.5-order TKE-based SGS turbulence and PBL Parameterization • 2-layer soil and vegetation model
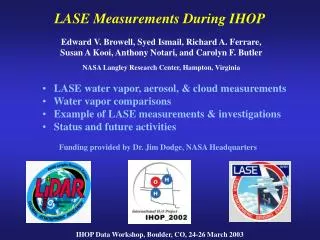
Data and Initial Conditions • IC fromADAS analysis with cloud/diabatic initialization • EtaBC for CONUS grid and background of IC analysis • Rawinsonde and wind profiler data used on CONUS and 9km grids • MDCRS (aircraft), METAR (surface) and Oklahoma Mesonet data on all grids • Satellite: IR cloud-top temperature used in cloud analysis. • CRAFT Level-II and NIDS WSR-88D data: Reflectivity used in cloud analysis on 9 and 3km grids, and radial velocity used to adjust the wind fields.
Cloud Analysis in the Initial Conditions • Level-II data from 12 radars (via CRAFT) and Level-III (NIDS) data from 12 others in the CGP were used • The cloud analysis also used visible and infrared channel data from GOES-8 satellite and surface observations of clouds • The cloud analysis procedure analyzes qv, T and microphysical variables
Computational Issues • The data ingest, preprocessing, analysis and boundary condition preparation as well as post-processing were done on local workstations. • The three morning forecasts were made on a PSC HP/Compaq Alpha-based clusters using 240 processors. • The 00 UTC SPstorm forecast was run on NCSA’s Intel Itanium-based Linux cluster, also using 240 processors. • Perl-based ARPScntl system used to control everything • Both NCSA and PSC systems were very new at the time. Considerable system-wide tuning was still necessary to achieve good throughput. A factor of 2 overall speedup was achieved during the period. • Data I/O was the biggest bottleneck. Local data processing was another.
Dissemination of Forecast Products • Graphical products, including fields and sounding animations, were generated and posted on the web as the hourly model outputs became available. • A workstation dedicated to displaying forecast products was placed at the IHOP operation center. • A CAPS scientist was on duty daily to evaluate and assist in the interpretation of the forecast products. • A web-based evaluation form was used to provide an archive of forecast evaluations and other related information. • The forecast products are available at http://ihop.caps.ou.edu, and we will keep the products online to facilitate retrospective studies.
Standard QPF Verifications • Precipitation forecasts scores (ETS, Bias) calculated against hourly rain gauge station data (grid to point) from NCDC (~3000 station in CONUS) • Scores for 3, 6, 12 and 24 h forecast length calculated • Scores calculated for full grids and for common domains • Scores also calculated against NCEP stage IV data (grid to grid) • Mean scores over the entire experiment period (~40 days) will be presented
Questions we can ask • How skillful is a NWP model at short range precipitation forecast? • Does hi-resolution really help improve precipitation scores, and if so, how much? • How much did the diabatic initialization help? • Do model predicted precipitation systems/patterns have realistic propagations, and what are the modes of the propagations? • Is parameterized precipitation well behaved?
ETS on all three grids 9km 27km 3km
Notes on ETS from the 3 grids • On CONUS grid, 3hourly ETS much lower than that on the two higher-res grids • 12 and 24-hour precip scores are higher on the CONUS grid (keep in mind the difference in domain coverage) • Skill scores decrease as the verification interval decreases, but less so on the 9km and 3km grids • High thresholds have lower skills • Second conclusion changes when comparison is on a common grid
Comments on ETS in common domains • ETS scores are consistently better on higher resolution grids when verification in the same domain • The differences are larger for shorter verification intervals • Improvements at low thresholds are more significant • Improvement from 27 to 9 km more significant than that from 9 to 3 km (0.28/ 0.17 v.s. 0.27/0.22) • The forecasts have less skill in the 3km domain (not grid), presumable due to more active convection • Keep in mind that the high-resolution forecast is to some extent dependent on coarser grid BC’s
Comments on Bias Scores • High biases are seen for high thresholds at all resolutions • High biases more severe at higher resolutions • Low biases are only observed at low thresholds on CONUS grid • Cumulus parameterization (KF scheme is known to produce high biases at high thresholds – e.g., ETA-KF runs of NSSL)? • Too much initial moisture introduced by cloud analysis? • Microphysics problem? • Too strong dynamic feed back? • Still insufficient resolutions to properly resolve updrafts? • Other causes?
3-hr accumulated precipitation ETS for different forecast periodsCONUS ETS verified on NCEP 236 grid (dx~40km)(May 15 – June 25, 2002) 0.21 Different 3 hour periods
Preliminary comparison with WRF, RUC, MM5, and ETA run during the IHOP 3hr accumulated precipitation ETS and Bias WRF, RUC, MM5 and ETA scores generated at FSL RTVS page at http://www-ad.fsl.noaa.gov/fvb/rtvs/ihop/station/ (earlier presentation by Andy Loughe) The scores were calculated by interpolating forecast to hourly gauge stations, and are for the first forecast period only (not the mean of periods over the entire forecast range) ARPS scores shown are against Stage IV gridded data
Comparison with WRF and RUC for the same period 3hr accumulated precipitation ETS and Bias versus thresholds 0.16 0.2 http://www-ad.fsl.noaa.gov/fvb/rtvs/ihop/station/ 0.01 0.1 0.25 0.5 0.75 1.0 1.5 2.0 3.0 2.7 1.5 0.01 0.1 0.25 0.5 0.75 1.0 1.5 2.0 3.0 WRF(22km) and RUC(20km) ARPS (27km)
Verified on SPmeso domain 6hr accumulated precipitation ETS and Bias versus thresholds 0.3 0.01 0.1 0.25 0.5 0.75 1.0 1.5 2.0 3.0 0.01 0.1 0.25 0.5 0.75 1.0 1.5 2.0 3.0 WRF(22km) and RUC(20km) ARPS (27km)
12hr accumulated precipitation ETS and Bias versus thresholds 0.35 0.38 0.01 0.1 0.25 0.5 0.75 1.0 1.5 2.0 3.0 0.01 0.1 0.25 0.5 0.75 1.0 1.5 2.0 3.0 WRF(22km) and RUC(20km) ARPS (27km)
SPmeso grid verification Comparison with WRF, ETA, MM5 and RUC for the same period 3hr accumulated precipitation ETS and Bias versus thresholds 0.23 0.01 0.1 0.25 0.5 0.75 1.0 1.5 2.0 3.0 0.01 0.1 0.25 0.5 0.75 1.0 1.5 2.0 3.0 WRF(10km),ETA(12),MM5(12) and RUC(10) ARPS (9km)
6hr accumulated precipitation ETS and Bias versus thresholds 0.01 0.1 0.25 0.5 0.75 1.0 1.5 2.0 3.0 0.01 0.1 0.25 0.5 0.75 1.0 1.5 2.0 3.0 WRF(10km),ETA(12),MM5(12) and RUC(10) ARPS (9km)
12hr accumulated precipitation ETS and Bias versus thresholds 0.35 0.01 0.1 0.25 0.5 0.75 1.0 1.5 2.0 3.0 0.01 0.1 0.25 0.5 0.75 1.0 1.5 2.0 3.0 WRF(10km),ETA(12),MM5(12) and RUC(10) ARPS (9km)
Hovmoller Diagrams of Hourly y (latitudinal) mean Precipitation • Questions: • Inspired by Carbone et al (2002) • How does the propagation of precipitating systems compare at different resolutions? • Does parameterized precipitation propagate at the right speed? • Is explicit precipitation on high-resolution grid better forecasted? • Predictability Implications
CAPS Real Time Forecast Domain 183×163 273×195 213×131
Hovmoller diagrams of hourly forecast rainfall for 15 May to 5 June 2002
Hovmoller diagrams of hourly forecast rainfall for 6-25 June 2002
Hovmoller diagram hourly forecast rainfall for 16-18 May 2002
Hovmoller diagram of hourly forecast rainfall for 23-26 May 2002
June 15, 2002, CONUS Grid NCEP Hourly Precip 27 km Forecast Precip Hourly Rate. L 14 hour forecast valid at 02 UTC
June 15, 2002, CONUS Grid NCEP Hourly Precip 27 km Forecast Precip Hourly Rate. 24 h forecast
June 15, 2002, CONUS Grid NCEP Hourly Precip 27 km Forecast Precip Hourly Rate. L 14 hour forecast valid at 02 UTC
June 15, 2002, 9km Grid NCEP Hourly Precip 9 km Forecast Precip Hourly Rate. L 14 hour forecast valid at 02 UTC
June 15, 2002, 9km Grid NCEP Hourly Precip 9 km Forecast Precip Hourly Rate. 24 hour forecast
June 15, 2002, 9km Grid NCEP Hourly Precip 9 km Forecast Precip Hourly Rate. L 14 hour forecast valid at 02 UTC
June 15, 2002 – 3km grid NCEP Hourly Precip 3 km Forecast Hourly Precip Rate L 11 hour forecast valid at 02 UTC
June 15, 2002 – 3km grid 3 km Forecast Hourly Precip Rate NCEP Hourly Precip Analysis 11 hour forecast
June 15, 2002 – 3km grid NCEP Hourly Precip 3 km Forecast Hourly Precip Rate L 11 hour forecast valid at 02 UTC
June 15, 2002 NCEP Hourly Precip ARPS 3 km Forecast – Comp. Ref. 11 hour forecast valid at 02 UTC
Hovmoller diagram of hourly forecast rainfall for 15-18 June 2002 Oklahoma
Comments on Hovmoller Diagrams • Propagation of precipitation systems is found on all grids, including CONUS and SPmeso that used cumulus parameterization • Propagation not necessarily faster on higher-resolution grids • The short forecast lengths (15 and 12h) of 3 km grid complicate the interpretation • More detailed process analyses are needed to understand the mode of comparison • Diagrams of observed precip will be created for comparison