Download
1 / 19
190 likes | 194 Views
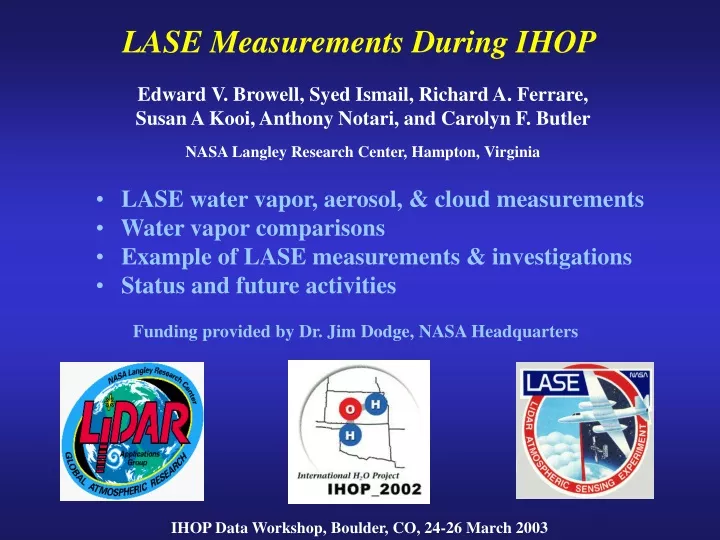
LASE Measurements During IHOP. Edward V. Browell, Syed Ismail, Richard A. Ferrare, Susan A Kooi, Anthony Notari, and Carolyn F. Butler NASA Langley Research Center, Hampton, Virginia. LASE water vapor, aerosol, & cloud measurements Water vapor comparisons

E N D
LASE Measurements During IHOP Edward V. Browell, Syed Ismail, Richard A. Ferrare, Susan A Kooi, Anthony Notari, and Carolyn F. Butler NASA Langley Research Center, Hampton, Virginia • LASE water vapor, aerosol, & cloud measurements • Water vapor comparisons • Example of LASE measurements & investigations • Status and future activities Funding provided by Dr. Jim Dodge, NASA Headquarters IHOP Data Workshop, Boulder, CO, 24-26 March 2003
LASE Water Vapor, Aerosol, & Cloud Profiling on NASA DC-8 9 June 2002 (Flt. 9) Morning Low Level Jet and Convective Initiation #3 • Water vapor profiles • - daytime and nighttime • - 0.2 km to upper trop. • - 0.01 to 25 g/kg • - accuracy: 6% or 0.01 g/kg • - resolution (variable) • vertical: 330 m • horizontal: 14 km (1 min) • Aerosol/cloud profiles • - daytime and nighttime • - 0.03 to 25 km • resolution (variable) • vertical: 30 m • horizontal: 200 m
LASE Water Vapor, Aerosol, & Cloud Profiling on NASA DC-8 9 June 2002 (Flt. 9) Morning Low Level Jet and Convective Initiation #3 • Water vapor profiles • - daytime and nighttime • - 0.2 km to upper trop. • - 0.01 to 25 g/kg • - accuracy: 6% or 0.01 g/kg • - resolution (variable) • vertical: 330 m • horizontal: 14 km (1 min) • Aerosol/cloud profiles • - daytime and nighttime • - 0.03 to 25 km • resolution (variable) • vertical: 30 m • horizontal: 200 m
LASE Measurements during IHOP • Acquired data on 8 IHOP science flights
LASE Water Vapor Comparisons Nighttime Daytime
LASE CI#2 Flight on 3 June 2002 • Dry line and associated convective evolution (3 LASE passes). • Capping inversion east of dry line near Homestead (H) ground site. Convection Low Clouds (Descend Under) H H H Dry Line In Situ Measurements Dry Moist
Terra MODIS Precipitable Water Vapor Terra MODIS 17:45 UT Near IR PWV • June 9, 2002 DC-8 Flight 9 • LASE and Terra MODIS measurements within 1 hour • Integrate LASE profiles to derive PWV Terra MODIS 17:45 UT IR PWV
IHOP June 9, 2002 5 MODIS Near IR 17:45 UT MODIS IR 17:45 UT 4 LASE 16:50-17:25 UT 3 Latitude 39 N PWV (cm) 2 1 0 -104 -103 -102 -101 -100 -99 -98 Longitude 30 MODIS near IR - LASE 20 10 Difference (%) 0 -10 MODIS IR - LASE -20 -30 -104 -103 -102 -101 -100 -99 -98 Longitude (deg) Terra MODIS Precipitable Water Vapor • MODIS near IR PWV • 10-20% higher than LASE • MODIS IR PWV • 0-30% lower than LASE • Results consistent with DOE ARM SGP PWV comparisons (Ferrare et al., 2002)
Forest Fire Smoke • June 9, 2002 DC-8 Flight 9 • Elevated Smoke Layer • HYSPLIT4 backtrajectories show smoke transported from NM fires • RH computed from LASE water vapor and S-HIS temperature • Increased scattering due to hygroscopic aerosols HYSPLIT4 (HYbrid Single-Particle Lagrangian Integrated Trajectory) Model, 1997. Web address: http://www.arl.noaa.gov/ready/hysplit4.html, NOAA Air Resources Laboratory, Silver Spring, MD.
May 30, 2002 DC-8 Flight 6 Boundary Layer Heterogeneity Start H C H H C
LASE Data Status and Future Research Activities • LASE Data Archived: • LASE nadir water vapor and aerosol scattering ratio measurements from DC-8 are in IHOP data archive and images are on web via Lidar Applications Group Home Page at http://asd-www.larc.nasa.gov/lidar/lidar.html (LASE water vapor profiles >400 m AGL) • Additional LASE Data Processing: • Complete extension of LASE water vapor below 400 m to surface and archive by May 2003 • Zenith LASE water vapor and aerosol data processing and archiving by September 2003 • Research Activities: • Collaborate with IHOP Science Team in utilizing LASE data in investigating/evaluating: Development of the convective PBL; Impact on forecasts of CI; Relationship between moisture gradients and LLJ development; Relationships between surface and PBL processes; Impact on quantitative prediction forecasts; Compare water vapor measurements between active and passive sensors for future measurement systems. • Produce Relative Humidity (RH) profiles using LASE water vapor and temperature profiles (Scanning HIS, NAST-I, AERI, radiosonde, high resolution model) • Compute Precipitable Water Vapor (PWV) using LASE water vapor profiles • Retrieve cirrus cloud optical and geometrical thickness from LASE cloud profiles • Compare/evaluate other water vapor measurements • Investigate relative humidity and aerosol humidification factor • Characterize vertical distribution of forest fire smoke during IHOP flights • Assess MODIS/MISR aerosol and water vapor measurements