Download
1 / 28
280 likes | 382 Views
The Financing of Illinois K-12 Education 1998-2007. Dr. Michael Jacoby Executive Director, Illinois ASBO Chair, Illinois Education Roundtable. Topics, Documents. Revenue/Expenditure Data 2008 AFR Rev and Exp Summary Data 1998-2008 Rev and Exp Graphs 1998-2008

E N D
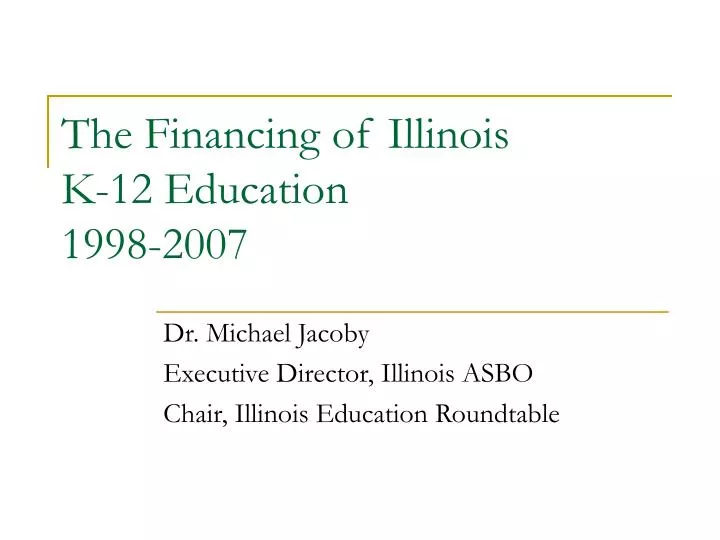
The Financing of Illinois K-12 Education 1998-2007 Dr. Michael Jacoby Executive Director, Illinois ASBO Chair, Illinois Education Roundtable
Topics, Documents • Revenue/Expenditure Data • 2008 AFR • Rev and Exp Summary Data 1998-2008 • Rev and Exp Graphs 1998-2008 • Historical Review of Funding Reform Proposals • Legislative Research Unit Report
How Data is Collected: (See 2007 AFR) Illinois Program Accounting Manual (IPAM) Revenue (by Fund [9] and Source): Annual Financial Report
Expense (by Fund [9], Function & Object): Annual Financial Report
Operating Fund Data – 10 Year Summary Source = ISBE Analysis of AFR Data 1998 - 2007
Inflation Adjusted • Inflation measured by the Consumer Price Index indicates that $1.00 in 1998 is equivalent in purchasing power to $1.27 in 2007. • Inflation Adjusted • Revenue Increase 1998 to 2007 = 22.4% • Expense Increase 1998 to 2007 = 18.5% • Policy Implication • CPI is not a reliable inflation index for education. • “ECI is a more accurate measurement of the inflationary spending pressures that school districts face” (EFAB 2005)
Expense Per ADA – Change from 1998 by Function Denotes potential policy implication or budget trend
Local Budget Trends • An increase in Debt Services within the Operating Funds suggests an increased reliance upon Tax or GSA Anticipation Warrants, or non-referendum debt (i.e. performance contracts). • Both principal and interest for these types of borrowing must be paid directly from the fund that receives the revenue. • Total Warrants/Notes issued or outstanding FY 2007 = $268M • Total principal/interest paid from Operating Funds in FY 2007 = $90.2M • An increase from 1998 of $63.6M
Expense Per ADA – Change from 1998 by Function Denotes potential policy implication or budget trend
Local Budget Trends • Employee benefit increases over 10 years have had a significant impact on school budgets. • This is primarily associated with health insurance premiums. • Total expense from Operating Funds in FY 2007 = $2.2B • An increase from 1998 of $1.05B
Benefit Cost Per ADA % Change from 1998 Total Cost Inc = $1.052 Billion
Local Budget Trends • Purchased Service increase suggests more external contracting by schools for various functions • Custodial Services + $211M or 76% over 1998 • Transportation Services + $224M or 82% over 1998 • Capital Outlay decrease suggests schools purchased less equipment or equipment at lower costs. • Education Fund down $74M or 25% decline over 1998 • Instruction down $30M or 21% decline over 1998
Local Budget Trends • Transfers decrease is difficult to discern and AFR data is not sufficient to make an evaluation. IPAM Definition: “This object category does not represent a purchase; rather, it shows that funds have been transferred in some manner. Included here are transactions for moving money from one fund to another and for transmitting flow-through funds to another LEA.”
Local Budget Trends • Tuition increase is summarized below: • Regular program increase suggests more districts paying tuition to other districts for programming. • Sp Ed increase is within expectations when compared with total expense increase 1998 to 2007 • Increase in CC tuition suggests more dual credit programs.
What About Special Ed? • Special Education Cost Study (PA 95-0555) • 2007 Study Findings • Expense = $3.2B • Revenue (specific sources) • Local $802M (25%) • State $1,132M (35%) • Federal $384M (12%) • Unsupported by specific sources • $900M (28%) • Policy Implication • Increased State Funding or More Local Tax Authority?
What About Special Ed? • 1998 to 2007 per ADA (select *Function #s) The PA 95-0555 Expense methodology is preferred, however comparable 1998 data is not currently available.
Local Budget Trend • Special Education expenses per ADA from 1998 to 2007 increased 64% compared to the total Education Fund increase of 45%. • Speech and Hearing expenses represented the largest increase at 134%. • As a % of the total Education Fund Budget, Special Ed increased from 16% in 1998 to 18% in 2007. • This 2% proportional increase = $334M
Illinois Funding Proposals • Handout • Historical Review of Selected Education Funding and Reform Proposals -Illinois Legislative Research Unit December 20, 2006