Download
1 / 11
110 likes | 123 Views
NSTX TF Flag Joint Design Review SUMMARY C Neumeyer 8/7/3. Topics. Performance Design Margins Design Improvement Summary Conclusions. PERFORMANCE. FEA Element Pressures and Resistivities. Red cells > 1 mW -in 2. Temperatures Well Below Limit of 120 o C.

E N D
Topics • Performance • Design Margins • Design Improvement Summary • Conclusions
PERFORMANCE FEA Element Pressures and Resistivities Red cells > 1mW-in2
Temperatures Well Below Limit of 120oC Max Temperature of 94oC Occurs Just After EOFT • Tflat = 0.7sec (vs. 0.6 req’t) • Bolt Holes not exactly modeled (+10oC) • OH constant at max current (-TBDoC) • Insignificant change from constant resistivity simulation Contact Region
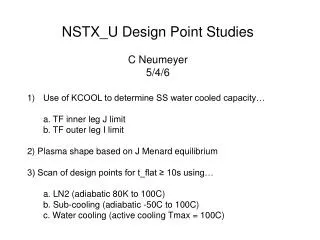
DESIGN MARGIN METHODOLOGY • State Safety Factor against Yield (as applicable) and against Failure • Flag bolts, Collar bolts, Box bolts • Compare load to published material data for yield and ultimate tensile • Threaded inserts and Shear Shoe bolts • Compare load to yield and failure data from pullout tests • Failure data based on 3s statistics • Yield based on stress/strain test curves , average yield/failure ratio • Wet lay-up • Compare load to failure data from shear tests at 1ksi compression • Failure data based on 3s statistics • FEA-derived loads • Use worst load from all 4 “nominal” cases: m =0.2,0.4, T= SOFT,EOFT
FEA peak/avg = 1.65 SHEAR TEST DATA INTERPRETATION
All defects contributing to original failure have been addressed
CONCLUSIONS • New Design Corrects All Defects Associated with Original Design • New Design Has Sufficient Margins at 6kG • Follow-on Activities Will Increase Confidence • Mechanical Prototype Testing • Electrical Prototype Testing • Instrumentation During Commissioning and Operations • - voltage drop (200A maintenance and real-time) system • - other (temperature, strain, displacement)