Download
1 / 12
120 likes | 262 Views
Standard Deviation & Z-Scores. Let’s start with an example. I divided the class into 2 teams, A and B. Coincidentally, the quiz average for team A is the same as team B, 81.5. So we expect a graph of their scores to be about the same, right?. Not so! . Let’s look at the scores:.

E N D
Let’s start with an example • I divided the class into 2 teams, A and B. Coincidentally, the quiz average for team A is the same as team B, 81.5. So we expect a graph of their scores to be about the same, right? Not so!
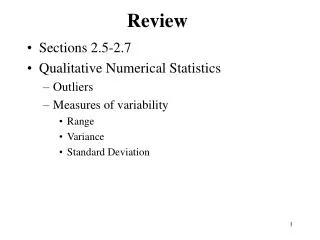
Standard Deviation is a number that tells us… • How far from “typical” a certain piece of data is. • How spread out the data items are.
Calculating the Standard Deviation, σ (sigma) Example • You and your friends have just measured the heights of your dogs (in millimeters): The heights (at the shoulders) are: 600mm, 470mm, 170mm, 430mm and 300mm.
Step 1: Calculate the mean Mean = 600 + 470 + 170 + 430 + 300 5 Mean = 1970 = 394 5 So the average height is 394 mm
Step 3: Square each of those results.Step 4: averagethe result. • We call this average the variance (σ2 ) σ2 =2062 + 762 + (-224)2 + 362 + (-94)2 5 σ2 = 108,520 = 21,704 5
Step 5: Find the square root of the variance σ2 to get the standard deviationσ • So, the Variance =21,704. • And the Standard Deviation is just the square root of Variance, so: • Standard Deviation: σ = √21,704 = 147
And the good thing about the Standard Deviation is that it is useful. Now we can show which heights are within one Standard Deviation (147mm) of the mean. • So, using the Standard Deviation we have a "standard" way of knowing what is normal, and what is extra large or extra small.
Rottweillersare tall dogs. And Dachsundsare…well, abit short ... but don't tell them!
Z-score Z-score – also called standard score indicates how many standard deviations an observation is above or below the mean. z-score = What is the z-score for the Rottweiler? Z-score = 1.4 σ