Download
1 / 10
100 likes | 192 Views
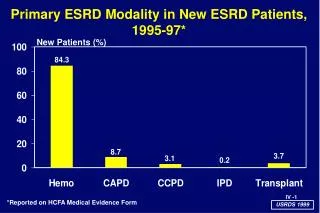
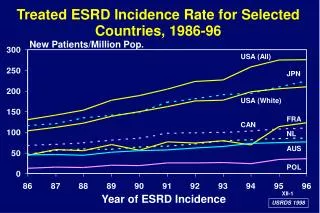
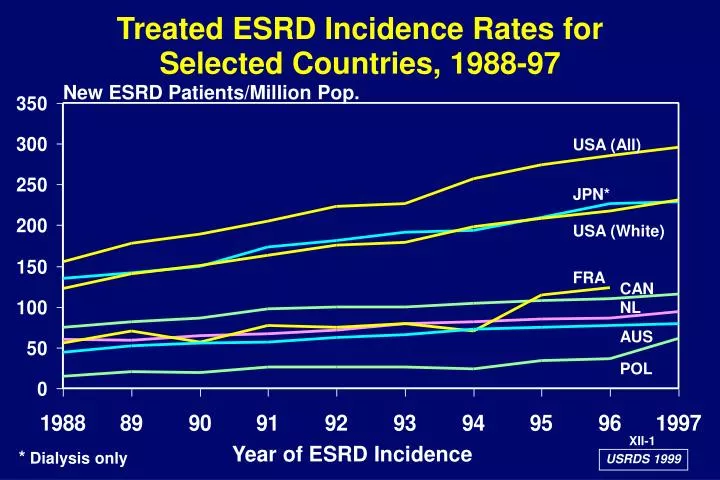
Treated ESRD Incidence Rates for Selected Countries, 1988-97. New ESRD Patients/Million Pop. USA (All). JPN*. USA (White). FRA. CAN. NL. AUS. POL. XII-1. Year of ESRD Incidence. * Dialysis only. USRDS 1999. ***. ***.

E N D
Treated ESRD Incidence Rates for Selected Countries, 1988-97 New ESRD Patients/Million Pop. USA (All) JPN* USA (White) FRA CAN NL AUS POL XII-1 Year of ESRD Incidence * Dialysis only USRDS 1999
*** *** USA SIN** NZ JPN** CAN* CHL HK* BEL DEN* AUS SWE URG NL FRA* ITA* POL Percent of Incident ESRD Patients with Diabetic Nephropathy for Selected Countries, 1997 New ESRD Patients (%) Country XII-2 * Data from 1996 ** Dialysis only *** Prevalent patients (dialysis only for Chile) USRDS 1999
Percent of Prevalent Dialysis Patients ReceivingHome Hemodialysis for Selected Countries, 1997 Dialysis Patients (%) NZ AUS FRA* NL CAN SWE GER* ITA* DEN* USA BEL JPN CHL POL BRZ URG Country XII-3 * Data from 1996 USRDS 1999
Percent of Prevalent Dialysis Patients ReceivingCAPD or CCPD for Selected Countries, 1997 Dialysis Patients (%) HK* NZ CAN DEN* AUS NL ISR* SIN SWE USA FRA* BRZ ITA POL BEL GER* JPN URG CHL Country XII-4 * Data from 1996 USRDS 1999
1996 1991 Trends in Utilization of CAPD/CCPD for Selected Countries, 1991/92 versus 1996/97 Dialysis Patients (%) Country XII-5 * 1990 vs 1996 USRDS 1999
1996 1991 Trends in Utilization of Home Hemodialysis for Selected Countries, 1991/92 versus 1996/97 Dialysis Patients (%) Country XII-6 * 1990 vs 1996 USRDS 1999
Transplantation Rates for Selected Countries, 1997 New Transplants/Million Pop. SPN USA NZ SWE DEN* NL CAN**IRL*FRA*AUS UK GER* ITA* HK* CHL POL BRZ URG JPN* Country XII-7 * Data from 1996 ** Fraction CAD approximated from 1995 USRDS 1999
Percent of Prevalent ESRD Patients with a Functioning Transplant, 1997 ESRD Patients (%) Country XII-8 * Data from 1996 USRDS 1999
Patients with a Functioning Transplant per Million Population, 1997 Functioning Transplants/ Million Pop. XII-9 Country * Data from 1996 USRDS 1999
Trends in the Utilization of Transplantation for Selected Countries, 1992 versus 1997 New Transplants/Year/Million Pop. Country XII-10 * 1992 vs 1996 ** 1993 vs 1996 USRDS 1999