Download
1 / 26
270 likes | 433 Views
1988. 25 years of HOT. Station ALOHA (~4750m deep). Hawaii Ocean Time-series (HOT) October 1988 - present (260 cruises; ~10/yr). 25 years of HOT. Station ALOHA (~4750m deep). NSF NOAA State of Hawaii (UH/SOEST). Hawaii Ocean Time-series (HOT) October 1988 - present (260 cruises; ~10/yr)

E N D
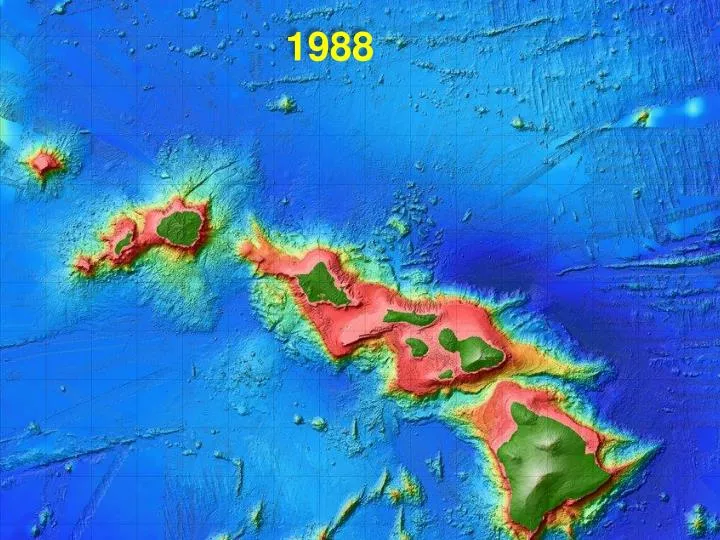
25 years of HOT Station ALOHA (~4750m deep) Hawaii Ocean Time-series (HOT) October 1988 - present (260 cruises; ~10/yr)
25 years of HOT Station ALOHA (~4750m deep) NSF NOAA State of Hawaii (UH/SOEST) Hawaii Ocean Time-series (HOT) October 1988 - present (260 cruises; ~10/yr) Mahalonuiloa to countless folks for their contributions to the successes of HOT and Station ALOHA
R. Weller (WHOI) Quantifying the Surface Freshwater Flux at Station ALOHA Roger Lukas*, Fernando Santiago-Mandujano*, Albert Plueddemann+, Robert Weller+, Fred Duennebier*, Bruce Howe* * U. Hawaii at Manoa + Woods Hole Oceanographic Institution Ocean Sciences Meeting 2014
Tradewinds – Harvesting Water and Heat From the Ocean NOAA/OAR Ocean Reference Stations Donating to the warm pool
Precious Rains Hawaii’s tenuous water resources ∫(E-P)dt
WHOTS Rainfall and Evaporation Sean Whelan (WHOI) Rainfall – Has small space-time scales Not well-observed from space Poorly represented in NWP model-reanalyses
WHOTS and the hydrological cycle How stable and reliable are the trends estimated from limited observations? Observations limited in duration and spatial extent; exponential rainfall distributions in space and time
WHOTS Buoy Mixed Layer See poster #2463 by McCoy et al., this session
December 5th, 2012 Rainfall Event Molokai NexRad Station ALOHA Molokai NexRAD
WHOTS-9 Buoy data q prate wind speed wind direction SST Surface salinity
December 5th, 2012 Rainfall Event Hydrophone sound before rainstorm during rainstorm
Spectrogram for Dec 5th2012 db re 1µ Pascal 20 frequency(kHz) 15 4728 m 10 5 0 60 120 150 minutes from 08:50
ALOHA Cabled Observatory 17.5 KHz 10.5 KHz 4728 m 4 KHz
rainfall rate wind speed 4 KHz rainfall rate wind speed 10.5 KHz
17.5 KHz wind speed rainfall rate
TRMM rain radar mm/hr max min
TRMM Satellite Rainfall Estimates 5-day accumulation estimates
Numerical Weather PredictionModel Rainfall for Station ALOHA 120 WHOTS-9 80 ECMWF 40 0
Summary • Measured rainfall in situ much larger than satellite, comparable to NexRAD weather radar • Time-space variability of rainfall challenges freshwater budgets • Bridging scales is crucial for satellite ground-truthing, and verification of NWP and climate models • Related posters by Nystuen et al. (UW/APL); Poster by Monk et al. (BIOS); Poster by Yang et al. (UW)