Download
1 / 7
70 likes | 167 Views
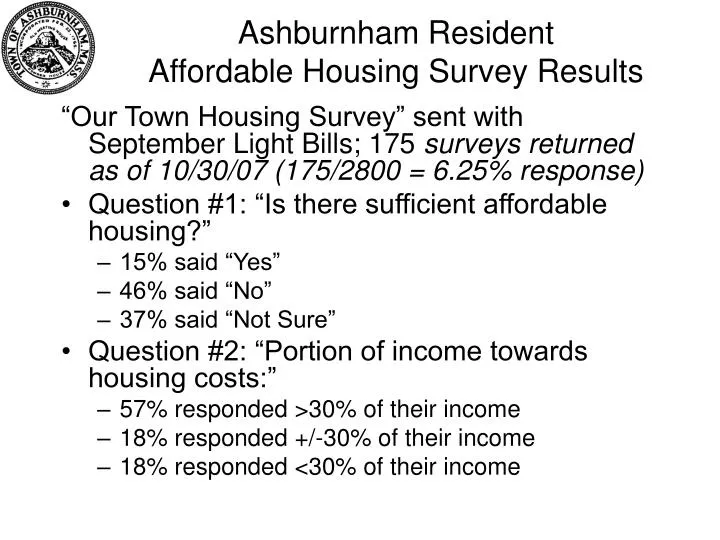
Ashburnham Resident Affordable Housing Survey Results. “Our Town Housing Survey” sent with September Light Bills; 175 surveys returned as of 10/30/07 (175/2800 = 6.25% response) Question #1: “Is there sufficient affordable housing?” 15% said “Yes” 46% said “No” 37% said “Not Sure”

E N D
Ashburnham Resident Affordable Housing Survey Results “Our Town Housing Survey” sent with September Light Bills; 175 surveys returned as of 10/30/07 (175/2800 = 6.25% response) • Question #1: “Is there sufficient affordable housing?” • 15% said “Yes” • 46% said “No” • 37% said “Not Sure” • Question #2: “Portion of income towards housing costs:” • 57% responded >30% of their income • 18% responded +/-30% of their income • 18% responded <30% of their income
Ashburnham Resident Affordable Housing Survey Results • Question #3: “What would you consider to be an affordable 2 bedroom apt:” • 29% indicated <$750 • 46% indicated between $751-$1000 • 15% indicated between $1001-$1200 • 7% indicated >$1200 • Question #4: “Segments of Ashburnham that have greatest Affordable Housing Needs” (multiple responses were provided) • 31% indicated Families • 72% indicated Elderly persons • 16% indicated Single People • 23% indicated Disabled individuals
Ashburnham Resident Affordable Housing Survey Results • Question #5 “Types of housing units that would best serve the Town:” (multiple responses were provided) • 27% indicated apartments • 37% indicated condominiums • 31% indicated duplexes (two-family) • 45% indicated single-family homes • Question #6 “Willingness for tax increase for support of affordable housing:” • 19% said Yes • 77% said No
Ashburnham Resident Affordable Housing Survey Results • Question #7 “Lack of Affordable housing negatively impact you or family member within last 12 months?” • 15% said “Yes” • 83% said “No” • Question #8 “Have you or family member had difficulty in:” • 8% indicated difficulty in finding appropriate housing • 20% indicated difficulty in staying in their own home • 7% indicated difficulty in both
Ashburnham Resident Affordable Housing Survey Results • Question #9 “Own or Rent?:” • 90% indicated Own • 5% indicated Rent • Question #10: 0% of respondents reside in subsidized housing • Question # 11: 13% would apply for subsidized housing if it were available.
Ashburnham Resident Affordable Housing Survey Results • Question #12 (Age Range of Respondents): • 0% were under 20 years old • 5% were between 20-29 years old • 7% were between 30-39 years old • 23% were between 40-49 years old • 24% were between 50-59 years old • 19% were between 60-69 years old • 18% were between 70-79 years old
Ashburnham Resident Affordable Housing Survey Results • Question #13 (Household Size): • 19% were from a one-person household • 35% were from a two-person household • 38% were from a 3-5 person household • 3% were from a 6+ person household