Download
1 / 31
330 likes | 454 Views
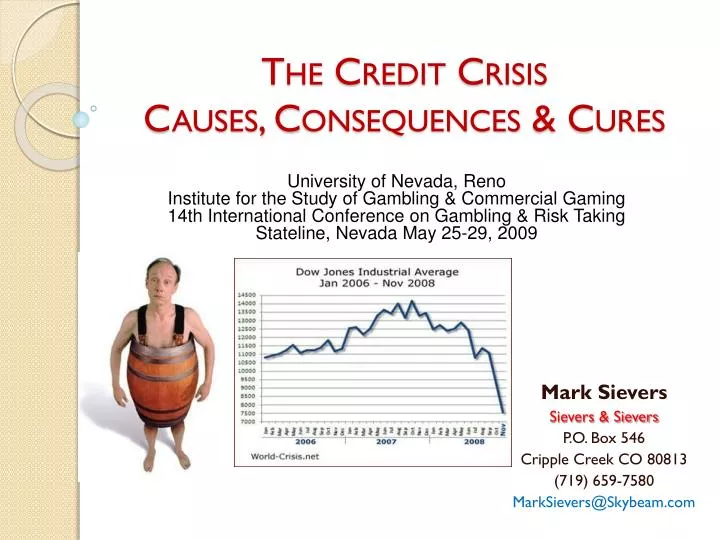
The Credit Crisis Causes, Consequences & Cures. University of Nevada, Reno Institute for the Study of Gambling & Commercial Gaming 14th International Conference on Gambling & Risk Taking Stateline, Nevada May 25-29, 2009. Mark Sievers Sievers & Sievers P.O. Box 546 Cripple Creek CO 80813

E N D
The Credit CrisisCauses, Consequences & Cures University of Nevada, Reno Institute for the Study of Gambling & Commercial Gaming 14th International Conference on Gambling & Risk Taking Stateline, Nevada May 25-29, 2009 Mark Sievers Sievers & Sievers P.O. Box 546 Cripple Creek CO 80813 (719) 659-7580 MarkSievers@Skybeam.com
May You Live in Interesting Times May all of Your Dreams Come True Gypsie Curses • 4 consecutive Qs of GDP declines • 2.7% in 3d Q 08 • 5.4% in 4th Q 08 • 6.4% in 1stQ’09 • 1% in 2nd Q ‘09 • 7.4million jobs lost since Jan. 08 • Unemployment rate = 9.7% (4.9% in Jan 2008) • Unemployment projected to be 10.5% in Dec. 2009 • Spending for business equipment dropped 30% • Industrial output dropped 20% in 1st Q 2009 (equal to 1998 levels) • Industrial capacity used dropped to 69% (lowest ever) • Banks in trouble • 89 bank failures in2009 • 416 banks failed FDIC grading system • Stock market (S&P 500) down about 40% from 2008 • June ‘09 average housing prices down about 30% from Jan. ‘07 • July ‘09 foreclosures 32% higher than July ’08 • 800,000 homes in foreclosure – expected to peak at 1.15 million in 2010 • Cure rates for defaulting mortgages: • Prime loans - 6.6% from 45% (2006) • Alt-A loans - 4.3% from 30% • Subprime – 5.3% from 19.4% • 1.4 million bankruptcies expected in 2009 – 75% higher than 2007
Interconnected Causes • Era of Easy/Cheap Money 2000-2005 • Greatly expanded the supply of loans • Created a Real Estate Bubble • Rise of the Shadow Banking System • Highly leveraged, risk-seeking business model • Equal in size to traditional banking system • Securitization of loans • Expanded cheap/easy money • Agency problems – “loan to sale” business models • Gambling with Credit Default Swaps widespread • Inability to re-negotiate defaulting loans and loans on property where value falls below loan principle
What (Who) Caused this Mess?Boom & Bust Monetary Policy • 2000-2004 – Fed reduces interest rates to combat 9/11 and dot-com recessions • Wave of cheap money Housing price bubble caused by: • Dramatically reduced mortgage rates & sub-prime mortgages increase house prices • Securitized loan instruments makes even more money available for cheap mortgages • 2005 – 2006 Fed increases interest rates and bursts the housing bubble • Falling House prices upside-down loans • Collapse in the securitized loan market • Fed missed the rise of securitization & highly-leveraged shadow banks • “May you come to the attention of higher authorities.”
Federal Reserve Monetary Policy Housing Price Bubble 1% Reduction in Market Mortgage Rates Causes a 10-16% Increase in Housing Prices Robert Schiller – Irrational Exuberance
Greenspan’s BubblesFine-Tuning the Economy with Monetary Policy 1999 Stock Market Bubble “Irrational Exuberance” 2006 Housing Price Bubble Source: Paul Krugman, The Return of Depression Economics (2009)
US & Japanese Real Estate Bubbles • Japanese decline 65%
Major Contributor – Securitization • Bundling & selling loans in bond-like instruments • 25% mortgages; 21% credit card loans; 13% auto loans; 15% other (student loans, business loans) • Massive Boom & Bust Cycle • 1997 $300 billion 2006 $2 trillion 2007 $121 billion • Agency Problems • Borrowers are unknown to the bundled loan purchasers – loan renegotiations are virtually impossible when borrower gets into trouble • “Loan to sale” business models -- compensation based on # of loans not loan quality (rise of unregulated mortgage brokers & mortgage lenders) • Serious Structural Problems • Low quality (sub-prime) loans in securitized tranches carried high returns, create incentives to make low-quality, risky loans • Valuation grossly complex making after-market sales to 3d parties nearly impossible • Insurance/Gambling via Credit Default Swaps
Securitization in a Nutshellaka Toxic Assets, Legacy Assets • Loans/Assets • Mortgages • Sub-Prime Loans • Alt-A Loans • FHA/VA Loans • Credit Cards • Auto Loans • Student Loans • Commercial Loans • Borrowers • Households • Businesses Special Purpose Vehicle Arranger • Securitized Instrument • Collateralized Debt Obligations • Collateralized Loan Obligations • Asset Backed Securities • Mortgage Backed Securities • Lenders • Banks • Credit Cards • Auto Lenders • Hedge Funds • Mortgage Lenders • Buyers (Highly Leveraged) • Investment Banks • Pension Funds • Hedge Funds • Private (Foreign) Investors Rating Agency • Insurers • Insurance Companies • Investment Banks • Hedge Funds • Individuals • Speculators • Investment Banks • Hedge Funds • Investors Credit Default Swaps
Securitized Loan InstrumentsThe Waterfall Securitized loan portfolio divided into tranches of bond-like instruments with different prices, interest rates and claims on cash flow • Senior Tranche • High quality loans • Priority on cash flow • Lower coupon • Loans/Assets • Mortgages • Sub-Prime Loans • Alt-A Loans • FHA/VA Loans • Credit Cards • Auto Loans • Student Loans • Commercial Loans • MediumTranche • Medium quality loans • 2d Priority on cash flow • Higher coupon • Prices determined by changes in : • Risk rating by rating agency • Interest rates (P when interest rates ) • Loan to value ratio (Market price of assets) • Repayment patterns (Foreclosures) • Junior Tranche • Lowest quality loans • Last priority on cash flow • Highest coupon
Leveraging & Shadow Banks(Magnifies Returns & Losses) Conservative Lenders 10% Loan Terms 10% Return to Conservative Lenders $95 M Lender’s Money $95 Million Hedge Fund Money $5 Million $9.5 M $100 Million Security 10.5% Return Hedge Fund Investors $1 M 20% Return to Hedge Fund Investors $5 M • Problems: • Moral Hazard – Hedge Fund gambles with Conservative Investors’ Money • No Regulatory Oversight of Leveraging • Oct. 2004 -- SEC suspended net capital rule for largest investment banks eliminating regulatory restrictions on leveraging
Shadow Bank Run Federal Reserve Increases Interest Rates Causes Bond Prices to Fall Credit Default Swaps: Bets that firm will fail.
How Long this will Last?CBO Estimates – 2014 before GDP Growth Returns to NormaL Congressional Budget Office: A Preliminary Analysis of the President’s Budget and an Update of CBO’s Budget and Economic Outlook (March 2009). • Assumptions: • No exogenous shocks (e.g., no oil price , major bankruptcies,) • Government solutions actually work -- do not create other issues
Now, the Bad News • Expects further declines in real estate prices • Japan’s experience – 65% overall decline; 83% decline in commercial real estate • Commercial real estate bubble expected to be as large as securitized mortgage losses • Alt-A and Jumbo mortgages (bigger than sub-prime) have begun to reset • Why renew a mortgage on a property worth less than the mortgage? • Potential bank-run from pre-existing lines of credit • Approximately $4.5 trillion outstanding • Large, high-profile insolvencies disrupting markets(GM, Citigroup) • State, local government shortfalls • State/Local governments cannot engage in deficit spending, so MUST increase taxes or substantially decrease spending – both options retard economic growth • Political pressure to erect trade barriers to protect domestic industries • Replay of Smoot-Hawley disaster of the Great Depression • Return of Stagflation • Replay of the Great Inflation driven by dramatic increases in government spending • Unemployment > 15% (projection for Dec. 2009 = 10.5%)
Economic Policy Cures…Digging out of the Hole • Stimulate the Economy • Fix the Credit Markets • Keynesian Policies • Spend LOTS of money on stimulus projects • Monetary Policies • Federal funds rate = 0% • Discount window = 0% • Interest on reserve requirements • Trade Barriers • Not yet happened • Government Buys Toxic Assets • Quasi-Nationalization • Government invests in financial firms • Government Guarantees • Government issues auto warrantees, guarantees bank deposits • New Banking & Investment Regulations • Bans/Restrictions on Short Sales • Prevents runs on leveraged firms • Bankruptcy to Clean Up Illiquid Assets & Force Re-negotiation of Loan Terms • Bankruptcy courts empowered to alter terms of mortgages • Pre-packaged bankruptcy of Chrysler
Putting the Numbers in Context(Take a very deep breath before proceeding …)
Bailout & Stimulus Programs As of May 8, 2009 (changes daily)
The government gives money at risk of loss. Government as an InvestorCommitment = $4. 8 trillion
Government as a LenderCommitment = $2.3 trillion A promise to pay back a government loan
Government as Insurer/GuarantorCommitment = $5.14 trillion The government promises to pay if things go badly.
Raw Government Spending (Pork)Commitment = $1.2 trillion The government just spends money. Gross Domestic Product = Consumer Spending + Government Spending - Taxes + Business Investment + Exports – Imports Keynesian Economic Prescription Government deficit spending will stimulate economic growth
The Stimulus “Bubbles”HR-1 – American Recovery & Reinvestment Act
Does Government Spending Stimulate Economic Growth? Government Deficits Government Deficits Boom years when government ran a surplus and when spending dropped Government Surplus Recent US Experience 1990-2008 Net Government Spending (Spending minus Taxes) Vs. GDP Growth Data Source: US Bureau of Economic Analysis Timeseries: 1990(1q) – 2008(4q) in constant 2000 dollars (Trillions of $) “We’re all Keynesians, now.” Richard Nixon
Does Government Spending Stimulate Economic Growth? “We’re all Keynesians, now.” Richard Nixon Increase in GDP Growth If deficit spending was correlated with economic growth, points should be clustered around a line like this. Decrease in net government spending Increase in net government spending Correlation between GDP Growth and Net Government Spending = 0.05 1 means perfect correlation 0 means no correlation Decrease in GDP Growth Historical Correlation between GDP Growth and Net Government Spending (Spending minus Taxes) Data Source: US Bureau of Economic Analysis Timeseries: 1970(1q) – 2008(4q) in constant 2000 dollars Vertical Axis: % Change in GDP Horizontal Axis: % Change in Net Government Spending w/6 month lag
Looking into the Crystal Ball • Can we spend our way out of the crisis? • Didn’t work in Japan • No correlation (0.05) between spending & economic growth • Sharp stimulus cutbacks will hit state/local governments hard • How will we pay for the spending & debt? • Increase taxes • Devalue the currency (inflation) • Collapse offoreign-government lending to US • Zombies • Firms kept alive for political reasons but that consume resources and slow the recovery • GM, AIG, Citigroup, Chrysler • New Regulations • Expansion of bankruptcy and government to intervene in private agreements • End of high-flying investment banks & loan securitization
Top 10 Business Strategies • Be Realistic/Pessimistic • This won’t turn around quickly. • Exogenous Shocks to Equities • Finance for expansion by IPO or new share issues is unrealistic. • Right Size, Right Now • Don’t staff at levels in hopes that things will turn around soon. • Outsource as much as possible • Investigate Your Lender • Assess likelihood of lender’s failure. • Draw down lines of credit (especially for critical projects) • Understand Landlord/Tenant Issues • What happens if your landlord owner becomes insolvent • Tenants have strong economic incentives to terminate leases • Shed Real Estate Investments • Commercial real estate fell 83% in Japan • Keep your customers happy • It is easier to keep old customers than to attract new customers • Market Smart • Cut everything before marketing • Focus on how your product meets the new economic reality (e.g., saves customers’ money) • Keep remaining employees happy • Employee problems can spook customers. • Review your vendors • Back-ups for critical vendors • Contract review for insolvency, force majeure and dispute resolution