Download
1 / 54
590 likes | 961 Views
The Financial Crisis of 2008: Causes and Consequences. J. Peter Ferderer Macalester College. 21 October 2008. Outline. A Chronology of the Collapse Eight Causes Maturity Mismatch and Leverage Another Great Depression? Q & A. Parallels to Natural Phenomena. Source: The Economist.

E N D
The Financial Crisis of 2008: Causes and Consequences J. Peter Ferderer Macalester College 21 October 2008
Outline • A Chronology of the Collapse • Eight Causes • Maturity Mismatch and Leverage • Another Great Depression? • Q & A
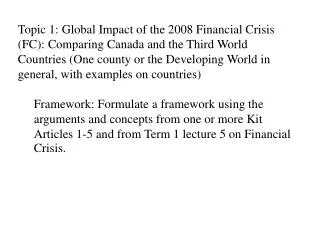
Parallels to Natural Phenomena Source: The Economist
Parallels to Natural Phenomena Source: The Economist
Parallels to Children’s Stories Source: The Economist
Bank Failures start in Europe • German and French Special Investment Vehicles (SIVs) unable to rollover commercial paper and close funds (August 2007) • U.K. experiences first bank run in more than a century (9/19/2007
14 March 2008: The First Investment Bank Collapses - JPMorgan Chase takes over Bear Stearns - Bear’s mortgage book might contain “whopping further losses” (The Economist) - The Fed makes $30 billion loans to I-banks as well as regulated banks - a significant shift in policy
13 July 2008Federal Government Takes over Freddie and Fannie Mac - Fannie and Freddie own or guarantee $5.2 trillion in mortgage debt
16 September 2008: When things went from bad to worse - Lehman Brothers – Wall Street’s 4th largest Investment Bank – collapses - Barclay’s and Bank of America step away - U.S. Treasury lets Lehman go - Counterparty risk spikes as Lehman files for bankruptcy
17 September 2008:Size Matters - American International Group (A.I.G.) fails due to credit-default swaps. - The government takes control of the company
24 September 2008: And then there were None - Goldman Sachs and Morgan Stanley convert into bank holding companies • Mitsubishi UFJ buys 20% of Morgan • Warren Buffett injects $5 billion into Goldman
September 25: The Biggest Bank Failure in History - Regulators seize Washington Mutual, the country’s largest savings and loan institution and sell most of its operations to JPMorgan Chase. - More than $300 billion in assets (Continental Illinois, had $40 billion when it toppled in 1984).
3 October 2008 Bailout Bill Passes • $750 billion ($2,500 per American) • Initially created to buy “toxic” assets off financial institution balance sheets • $250 used to buy ownership positions in banks.
The Magnitude of the Problem • Estimated worldwide losses on debt: $1.4 trillion (IMF) • $760 billion written down by banks, insurance companies, hedge funds and others • Cost of average systemic banking crisis in OECD counties over the past few decades: 16% of GDP • Cost of the U.S. bailout so far: $760 billion (7% of GDP)
Explanation #1Asymmetric Monetary Policy - Too much borrowing - Too much short-term borrowing
Explanation #2:The Savings Glut in the ROW United States r Rest of the World r S SROW r* r* I IROW I0 S0 S1 S0 I0 I1 Loanable Funds Loanable Funds NCOUS<0 NCOROW>0
Explanation #3 Democraticisation of Home Ownership - Community Reinvestment Act of 1977 - Fannie Mae and Freddie Mac (Government- sponsored mortgage buyers) were encouraged to guarantee a wider range of loans in the 1990s. - Tax deductibility of mortgage interest payments
Explanation #4 The Great Moderation Source: Dallas Federal Reserve Economic Letters (September 2007)
Explanation 5 Erosion of Lending Standards • Adjustable Rate Mortgages (ARMs) • No-documentation mortgages • No down payments • NINJA mortgages (“No income, no job or no assets”)
The Default Decision 20 Percent Down Nothing Down Home Value $100,000 $100,000 $90,000 $90,000 Mortgage $80,000 $100,000 Equity $20,000 $0 $10,000 - $10,000 Suppose the market price of homes falls What does home owner do it they need cash due to loss of job or medical emergency?
Explanation #6Innovation – New Financial Instruments - New instruments allow risk spreading - Options - Interest-rate and credit-default swaps - Securitization (Collateralized Debt obligations, CDO)
Securitization Source: The Economist
Credit-Default Swaps Source: The Economist A.I.G. $20,000 per person
Explanation #6Innovation – New Financial Instruments 1. Upside to greater risk spreading • The cost of capital falls • Credit is “democratized” • The system is more resilient to shocks 2. Downside - Large counterparty risk - Difficult for regulators to keep track of firm exposure (A.I.G.)
Explanation #7Innovation – Off the Balance Sheet Problem:Loan defaults expose banks to insolvency Solution: Basel Accord I (1988) mandates that banks must hold $0.08 in capital for every $1.00 in assets Impact on Banks: Reduces their ability to increase profits through leverage Bank Response: Create “Structured Investment Vehicles” (Basel capital requirements for credit linesto SIVs are less than 8%.)
The Old Model $ $ Savers Borrowers Savings & Loans Savings Account mortgages $ $ Commercial Banks Business loans Demand Deposits $ $ Investment Banks Bonds Stocks Bonds Stocks
The New Model funds funds Borrowers Commercial Banks Savers mortgages deposits mortgages Structured products (“Collateralized Debt Obligations”) are portfolios of mortgages, split into tranches. InvestmentBanks structured products • Diversification (regional)- Heterogeneous risk appetites (“Super Senior” v. “toxic waste”) Pension Funds Hedge Funds Structured Investment Vehicles (SIVs)
Three Problems with the SIVs • Maturity Miss-match (long-term assets funded by short-term liabilities) exposes them to funding and liquidity risk • Excessive Leverage to Increase returns makes the system more fragile • Liquidity Problems spill over to sponsoring Commercial and Investment Banks
Structured Investment Vehicles Risk perceived to be low
Commercial Paper Outstanding Source: Brunnermeier (2008)
Problems Rolling over ABCP BNP Paribus closes funds Lehman Brothers fails Liquidity injections by Central Banks Bear Stearns fails
Leverage Example Financial Intermediary Assets Liabilities L = A/(A-L) Securities: $100 Equity: $10 = 100/(100-90) Debt: $90 = 10 Financial firm manages its balance sheet to maintain constant leverage
Event: Security Prices rise by 1% Financial Intermediary Assets Liabilities L = A/(A-L) Securities: $101 Equity: $11 = 101/(101-90) Debt: $90 = 9.18 How must firm react to keep leverage at 10? Issue more debt and buy more securities
Event: Security Prices rise by 1% Financial Intermediary Assets Liabilities L = A/(A-L) Securities: $110 Equity: $11 = 110/(110-99) Debt: $99 = 10 Thus a $1 rise in the price of securities leads to a $9 increase in debt and security purchases
Event: Security Prices fall by 1% Financial Intermediary Assets Liabilities L = A/(A-L) Securities: $110 Equity: $11 = 109/(109-99) $109 $10 = 10.9 Debt: $99 How must firm react to keep leverage at 10? Sell $9 of securities and pay off $9 in debt Role of Mark-to-Market
Balance sheet after assets sold Financial Intermediary Assets Liabilities L = A/(A-L) Securities: $100 Equity: $10 = 100/(100-90) Debt: $90 = 10
Implication: Positive feedback loops and amplification rising/falling asset prices Stronger/weaker balance sheets - Contagion across balance sheets
The Cost of Making Markets Liquid The average credit spread of the 15 largest credit derivative dealers (ABN Amro, Bank of America, BNP Paribas, Barclays Bank, Citigroup, Credit Suisse, Deutsche Bank, Goldman Sachs Group, HSBC, Lehman Brothers, JP Morgan, Merrill Lynch, Morgan Stanley, UBS, and Wachovia.)
Another Great Depression? Source: The Economist
Spillovers The Economist
Fed Policy The Economist
Reason for Optimism: Size of Government Y = C + I + G + (EX – IM)
No External Constraint 9/11 Y2K