Download
1 / 25
250 likes | 360 Views
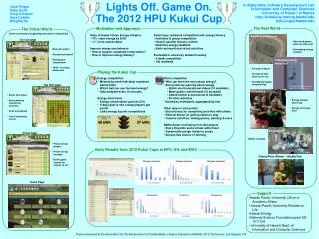
2012 UH and HPU Kukui Cup Energy Consumption Data: Preliminary Report. Philip Johnson Collaborative Software Development Laboratory Information and Computer Sciences University of Hawaii. UH Data Background. Data points at weekly intervals. Prior to challenge (August):

E N D
2012 UH and HPU Kukui CupEnergy Consumption Data:Preliminary Report Philip Johnson Collaborative Software Development Laboratory Information and Computer Sciences University of Hawaii
UH Data Background • Data points at weekly intervals. • Prior to challenge (August): • One data point last week of August • Challenge (Month of September): • Four data points during September. • Orange rectangle highlights interval • Post challenge (October) : • Three data points in October.
Lokelani and Mokihana Buildings • Upward trend in consumption.
Ilima and Lehua Buildings • Lehua "flat" for first 2 weeks, then upward trend
UH Lounge-level Data For ease of review, only 2 or 3 lounges per chart
UH Ilima A, B • Little apparent impact of challenge.
UH Ilima C, D, E • Ilima-E: flattened for first week, then upward. • Ilima-D: flat the whole way through.
UH Lehua A, B • Little apparent impact of challenge.
UH Lehua C, D, E • Lehua-D: ~9% decrease from 8/27 to 9/17 (64% participation)
UH Lokelani A, B • Little apparent impact of challenge. (43%, 9% participation)
UH Lokelani C, D, E • Little apparent impact of challenge. (50%, 20%, 33% participation)
UH Mokihana A, B • Little apparent impact of challenge. (28%, 38% participation)
UH Mokihana C, D, E • Little apparent impact of challenge (38%, 32%, 21% participation)
HPU Data Background • No lounges: all building level. • 3 week challenge: • September 17 – October 7 • Orange rectangle around interval • Lehua building data • Not available due to meter misconfiguration.
HPU Lokelani • 20% drop from 9/17 to 9/24 (100% participation)
HPU Mokihana • 13% drop from 9/10 to 9/24 (64% participation)
HPU Melia • Little apparent impact of challenge. (8% participation)
HPU Kukui • Little apparent impact of challenge. (9% participation)
HPU Ilima • Little apparent impact of challenge. (9% participation)
Insight 1: Participation • Level of participation is correlated with perceptible change in consumption on weekly basis. • If participation is greater than 60%, then consumption changes perceptibly • UH/Lehua-D: 64% participation, 9% drop • HPU/Mokihana: 64% participation, 13% drop • HPU/Lokelani: 100% participation, 20% drop
Insight 2: Building level trends • UH buildings showed a significant increase in energy consumption from August to October. • Effect of competition was to temporarily "flatten" this increase. • HPU Buildings did not show this trend. • Effect of competition was more significant. • Not sure why there is this difference between UH and HPU.