Download
1 / 22
220 likes | 413 Views
Experimental phase equilibrium study. Isothermal study (sample preparation and characterisation methods ). Diffusion couple – local equilibrium. Experimental methods used for phase diagram construction. Dynamic methods. Static methods. Metals Ceramics.

E N D
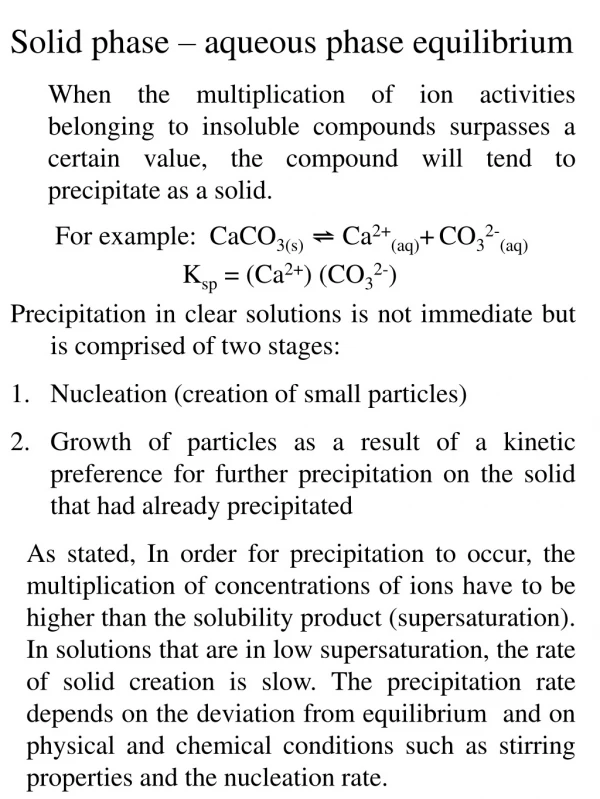
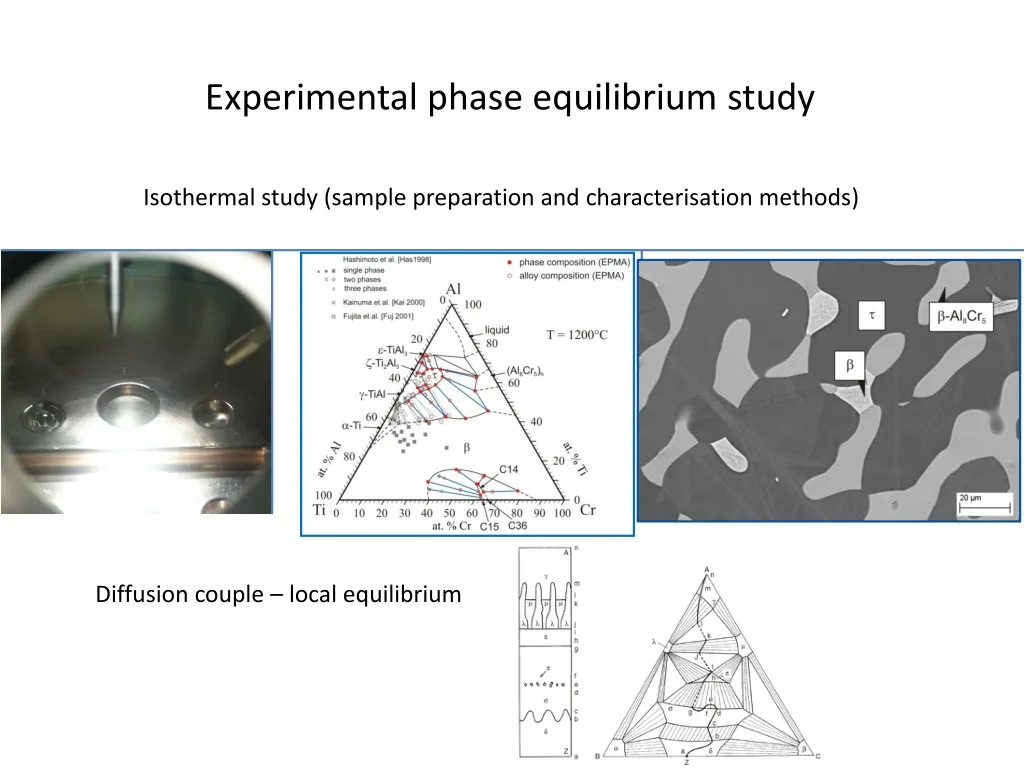
Experimental phase equilibrium study Isothermal study (sample preparation and characterisation methods) Diffusion couple – local equilibrium
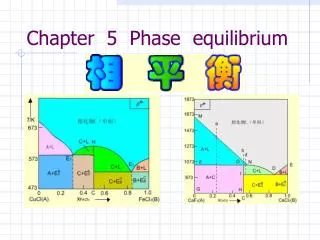
Experimental methods used for phase diagram construction Dynamic methods Static methods Metals Ceramics DTA/TGA DSC Dilatometry TMA Arc-melting Induction melting Solid state reactions Co-precipitation and pyrolysis Homogenisation Heat treatment Quenching In-situ study In-situ study Natural cooling or quenching Diffusion couples Characterisation methods XRD – phase identification, phase boundary determination SEM/EDX microstructure examination, phase composition determination (for identification) EPMA for more precise phase identification EBSD for structure determination
Methods of sample preparation of metal alloys Raw materials in desired ratios are melted in high-temperature furnaces in protective gas atmosphere (Ar, He) or in vacuum. Arc-melting Consumable and non-consumable electrode Upper electrode (cathode) is water cooled Cu pole inlaid with W head, the lower electrode (anode) is metal to be melted. A water cooled Cu platform is not only a crucible for melted alloy but also part of positive electrode. Under inert gas or vacuum an electric arc forms an ion plasma. The electric current passing through the electrode melts the anode metals. Alloys are usually melted several times to ensure homogeneity. Vacuum: Positive: To avoid oxidation, impurity removal, high temperatures Negative: component evaporation Inert gas atmosphere: Positive: To avoid oxidation, impurity removal, less component evaporation Negative: temperature is lower
Induction melting Induction heating is heating of electrically conducting object by electromagnetic induction through heat generated in the object by eddy currents. An inductor consists of electromagnet and an electronic oscillator that passes a high-frequency alternating current through electromagnet. The rapidly alternating magnetic field penetrates the object generating electric current. Electric current flowing through the resistance of material heat it by Joule heating. Heating process is short and high temperature can be obtained rapidly. Natural stirring effect originating from induction current helps to homogenise alloys. Melting process can be carried out in inert gas or vacuum atmosphere. High-frequency induction melting is suitable for variety of alloys. Compared with arc melting it allows to prepare samples that contain volatile components such as Mn, Sb, Pb. Crucibles are used (Al2O3, graphite). Another way is to put a mixture of starting metals in a quartz ampoule, which is then evacuated and encapsulated. Using master alloys (Ni-40%B prepared by arc melting). M.P. B is 2092°C, M.P. Ni-40%B is 1020°C. Scheme for induction melting of alloys containing elements of very diverse boiling points.
Powder metallurgy method For alloys with oxidizable or volatile components or that may undergo severe compositional segregation during solidification powder metallurgical methods are better than high-temperature melting. PM process consists from three steps: powder pulverisation, die compaction and sintering. Compaction is performed at room temperature and sintering occurs at elevated temperature and atmospheric pressure under carefully controlled atmosphere composition (usually in protective atmosphere). Temperature of sintering is below melting point of major constituent. In some cases minor constituent can form a liquid phase; such cases are described as liquid phase sintering. Non-equilibrium condition could occur during sintering. As a result, liquid phase can appear at temperature lower than solidus. This liquid phase leads to overgrowth of crystals and compositional segregation. Further homogenisation treatment is required. Other techniques: hot isostatic pressing, spark plasma sintering
Experimental methods to construct phase diagrams for ceramics Sample preparation Solid state reactions Co-precipitation (for slow-reacting oxide system) Starting materials are oxide mixtures and/or oxy-salts (e.g. carbonates). When heated oxy-salts decompose forming oxides and gas products released from sample. The starting powders are mixed together by grinding in agate mortar with small amount of acetone or alcohol. Automated milling can be also used. Starting materials are salts (e.g. nitrates , dissolved in water or mineral acids). Elemental analysis should be done to control composition (ICP-OES). NH4OH is used for precipitation of hydroxides. After drying to remove most of the water, the samples are calcined to form oxide mixture. Other sol-gel methods including organic substances. Pyrolysis is necessary to destroy organic materials. The mixed powders are pressed into pellets and heat treated at desired temperatures. Pt-crucibles or foil packets are recommended. Sample characterisation: XRD, SEM/EDX, EPMA
Experimental methods to construct phase diagrams for ceramics Oxygen partial pressure control When heated under isothermal condition M/MOx mixture will exchange oxygen with the carrier gas until equilibrium pO2 is established according to the following reaction Scheme of using metal/metal-oxide buffers to control oxygen partial pressure Buffer gas mixtures pO2depends on CO/CO2 ratio and temperature
Homogenisation heat treatment To accurately establish a phase diagram, it is important to reach equilibrium state. During solidification from liquid non-equilibrium structures are easily generated. Powder metallurgy sample are also require homogenisation because sintering is short and it is non-equilibrium process. Homogenisation heat treatment involves putting samples into furnace at high temperature below the solidus temperature for an extended period of time. The samples then quenched from elevated temperature to the room temperature to freeze the phases stable at elevated temperature for analysis. Homogenisation is achieved through diffusion, thus annealing temperature and diffusion are two important factors. The success of quenching method depends on preservation of high temperature equilibrated phases at room temperature. The method is appropriate for sluggish phase transformations. One limitation is difficulty to determine phase transformation accurately. Another problem is that quenched sample may not represent the equilibrium state.
Characterisation methods Composition of sample is controlled by chemical analysis (i.e. ICP-OES) or EPMA (electron probe microanalysis) XRD Identification of phases present in the sample, quantitative determination of phase amounts, lattice parameters and grain sizes by Rietveld analysis Determination of crystal structure of a new phase Lattice parameter method to determine phase boundary Determination of ternary phase diagram using lattice parameter method: a. isothermal section A-rich corner; b. variation of lattice parameter of phase a along the tie-line; c. not along the tie-line; d – variation of lattice parameters of a along the line being across two phase and three phase region Binary system: different trends of lattice parameters vs. solute concentration
Metallography Small samples are inlaid in polymer resin, mechanically ground and then polished Optical microscopy: to determine number of phases, invariant reaction type, volume fraction, homogeneity, surface contamination Scanning electron microscopy (SEM) often coupled with energy dispersive X-ray microanalysis (EDX): To determine invariant reaction type, to distinguish phases by different contrast ( BSE) and determine phase composition by EDX, to determine phase structure (EBSD), SE is used for surface topology. Limitation of phase composition measurements of SEM/EDX is grain size. It should be (2m). TEM can detect fine precipitates, to determine structure. Electron probe microanalysis (EPMA) is similar to SEM with wavelength dispersive spectrometers (WDS) attached. Grain size is also limitation. WDS is more accurate than EDS. EPMA is mainly used to measure composition of phases in two-phase or three-phase regions and then establish the boundary of single phase regions
Example: phase relations in Al-Cr-Ti system at 1473 K 70Al-27Ti-3Cr 54Al-34Ti-12Cr 60Al-20Ti-20Cr 54Al-34Ti-12Cr 50Al-25Ti-25Cr M. Kriegel et al. 2013 52Al-33Ti-15Cr
Combination of static and dynamic methods 1570 K U4: L+g-TiAlt+b 1354 K g-TiAl+bt+C14
Phase diagrams for ceramic systems Example: ZrO2-Eu2O3 Sample #2 66.67%ZrO2-33.33%Eu2O3 (Eu2Zr2O7) Tcor=2128 K ( HTXRD (lit.) 1997 or 2273 K) Sample #4 20%ZrO2-80%Eu2O3 Tcor=2155 K XRD 1873 K SEM/EDX heat treatment 1773 K, then 1923 K
TGA: thermogravimetric analysis TGA measure mass loss or gain with temperature and/or oxygen partial pressure. TGA can be used to investigate red/ox reactions in M/Oxide system and decomposition reactions accompanied by gas formation (e.g. CaCO3CaO+CO2 (gas)) Calculated potential diagram of the Fe-O system Experiment of Kitayama et al. (2004): Fe2O3 was equilibrated at 1100°C (1373 K) using various gas mixtures CO2/H2 and CO2/O2. WT is total weight gain from reference state (logpO2=-15 pure Fe) to Fe2O3 1 bar of O2. WO2 is weight gain from reference state of pure Fe to present p(O2). XRD is widely used in conjunction with TGA to identify phases before and after mass change.
In-situ measurements To study phase equilibria directly at temperature of interest using hot-stage microscopy, high temperature in-situ XRD. The advantages are No complications from quenching More straight forward interpretation of the results Study in a continuous temperature range The disadvantage is less availability of such equipment, more difficult experiments and potentially greater evaporation, oxidation In situ high temperature experiments are essential to study complex phase equilibria in narrow temperature range. Combinations of several methods DTA-TG DTA-TG-EGA Evolved Gas Analysis Analysis of chemical composition of the evolved gas by means of spectroscopic methods Coupling with FT-IR (Fourier transform infrared spectroscopy): Determination of specific bands (e.g. C=O, CH3, etc.) Coupling with mass-spectroscopy (detailed analysis of complex gas mixture)
Diffusion couple The use of diffusion couples in phase diagram studies is based on the assumption of local equilibrium at the phase interface in the diffusion zone. This means that very thin layer adjacent to interface is in equilibrium with neighboring layer on the other side of interface. Chemical potentials of components vary continuously in the product layer of the reaction zone and has the same value at both sides of interphase interface. Since diffusion takes place if there is thermodynamic potential gradient, the total system where diffusion occurs is not in equilibrium. Local equilibrium is established and maintained at the interfaces in the diffusion zone, which means that diffusion is very slow compared with the rate of reaction to form a new phase. Binary system Single phase product layers separated by parallel interfaces in sequence according to phase diagram. Ternary system Two-phase area and single phase area are possible. f=C+2-P T, P=fixed f=C-P f=1 to change composition P=1 for C=2; and P=2 for C=3
Preparation of diffusion couple The bonding faces of the couple components are ground and polished flat, clamped together and annealed at the temperature of interest. Depending upon initial materials protective atmosphere can be used (vacuum and inert gas). After heat treatment quenching of sample is desirable in order to freeze the high temperature equilibrium. Other plating techniques include plasma spraying and chemical vapour deposition (CVD) . These techniques are suitable for metals and non-metals. Thermal evaporation, electron beam evaporation or laser evaporation can be used to deposit second component onto a bulk substrate. Analytical techniques: EPMA. Standard metallographic procedure can be used to prepare bulk multiphase couples for EPMA. The measured concentration can be used to define tie-lines in the equilibrium phase diagram
Example: binary system Cu-Zn Fick‘s law – width of the layer ~ to t (time) Zn atoms diffuse much faster than Cu atoms. This explains why the intermetallic phases form on the Cu side of original Cu-Zn interface. This also explains the formation of voids in g and e phases since Zn atoms are moving towards the centre of the couple faster than Cu atoms moving to Zn side.
Ternary system The diffusion zone morphology developed in ternary couple depends on number, structure and topological arrangement of newly formed phases and the resulting microstructure can be visualized using the diffusion path . Diffusion path is the line in a ternary isotherm representing the locus of average composition in planes parallel to the original interface throughout the diffusion zone. Diffusion path must fulfill the law of conservation of mass. Diffusion path should cross the straight line between end-members of the reaction couple (mass balance line) at least once. If phases are separated by planar interphases, the diffusion path crosses the two phase region parallel to tie-line. However wavy interfaces or isolated precipitates can also form at or near a phase interface. Kirkaldy formulated a number of rules, which relates composition of the reaction zone to the phase diagram. The reaction path involves a time-independent sequence of intermediate layers. The plot give information about order of product layers, their morphology and composition.
Diffusion path in ternary system (scheme) a) Reaction zone structure in hypothetical couple A/Z of the A-B-C system b) Corresponding diffusion path on the isotherm of the ternary system. Dashed line parallel to tie-line in a two-phase region represents straight interface between single phases (g-h). A solid line crossing tie-lines represents locally equilibrated two-phase zone (b-c, j-k, l-m). Solid line entering two-phase region and returning back to single phase region (d-e-f-g )represents region of isolated precipitates. A dashed lines crossing the three-phase region represent interface between two phase and one phase layers (i-j) or two two-phase layers with one common phase (k-l).
Example: Ni-Cr-Ti system Isothermal section at 850°C Since a semi-infinite diffusion couple follows a unique diffusion path, very often a large number of couples should be studied experimentally to construct a ternary isotherm.
Possible sources of error Possible melting in the diffusion couple, poor adhesion at the interfaces, and accelerated reaction rate due to defects may complicate the interpretation of diffusion couple experiments. Difficulties associated with phase boundary concentrations in the reaction zone (uncertainty of EPMA), difficulties to measure composition at the interface, X-ray absorption and fluorescence effects. Errors arising from formation quasi-equilibrated diffusion zone. Sometimes certain phases seems to be missing when investigated by microscopic or microprobe analysis. One of the reasons for absence of an equilibrium phase can be presence of barrier layer at the interface such as oxide films or presence of impurities. Segregation of impurities can make nucleation of a certain phase difficult or cause metastable phase formation. The fact that equilibrium phase is not identified can be explained by slow growth kinetics (example Ti-Al couple indicates only TiAl3 at 625°C , while at 800°C Ti3Al/TiAl/TAl2/TiAl3 are found). Stabilisation by impurities (example Nb/Ni annealed at 1100°C NbNi3/m-Nb7Ni6 /Nb4Ni2N are forming). Formation of volatile reaction product affects diffusion path. Example Mo-Si-N system annealed at 1300°C Mo/Si3N4: dense Si3N4 – Mo3Si forms; porous Si3N4 – MoSi2 and Mo5Si3 form. In first case N2 forming due to reaction can not escape easily, while in the second case it can. Thus pressure of nitrogen determines activity of Si at metal/ceramic interface.