Download
1 / 32
330 likes | 445 Views
Experimental study of Non-Equilibrium Dissociation of Molecular Oxygen N.G. Bykova , L.B. Ibraguimova , O.P. Shatalov , Yu.V . Tunik , I.E. Zabelinskii Institute of Mechanics, Lomonosov Moscow State University, Moscow, Russia

E N D
Experimental study of Non-Equilibrium Dissociation of Molecular Oxygen N.G. Bykova, L.B. Ibraguimova, O.P. Shatalov, Yu.V. Tunik, I.E. Zabelinskii Institute of Mechanics, Lomonosov Moscow State University, Moscow, Russia 4-th EUROPEAN CONFERENCE FOR AEROSPACE SCIENCES (EUCASS) St. Petersburgh, July 17-22, 2011
Content • Measurement of time histories of vibrational temperature Тv and concentration of oxygen molecules behind a front of shock wave. • Determination of O2 dissociation rate constants both in the thermal non-equilibrium and thermal equilibrium zones behind the shock front. • Determination of oxygen vibrational relaxation time at high temperatures. • Testing some models of molecule dissociation.
Experiment: Spectral region and technique: Measurement of light absorption in region=210-260 nm (electronic transitionsX3-g→B3-u (Schumann-Runge system)). Experimental setup: Shock tube;gas in high pressure section is O2 / H2/ Не; gas in low pressure section is undiluted O2. Quantities measured: Initial gas pressure in low pressure sectionP1 (1 - 2 Torr); velocity of shock wave front V (3 - 4.5 km/s), absorbance in gas behind the front of shock wave– I/I0. Gas parameters behind the shock front: Temperature range: 4000-10800 К, Gas pressure: 0.2 - 1 atm
Experimental setup О2 Pulsed lamp Pumping system Filling system U PT Damper tank HPCMLPC Ar He Spectrograph PMP VM-1 H2 O2 Power of PMP Ajilent 54624A; Ajilent DSO-5014A
The light absorption and absorption cross sections • The Beer law describes the ratio I/I0 as: where I0 andI are the intensities of source radiation past through the test section before and after the shock wave arrival, respectively; σ(Tv,T) is the spectral absorption cross-section per molecule (cm2), l is the length of optical path (cm), n is the concentration of absorbing molecules (cm-3);Tvis the vibrational temperature of molecules, T is gas temperature. • In the present work that corresponds to optically thin layer of gas studied.
Absorption oscillogramms Initial conditions in gas:100% O2, P1 = 1Torr, V=4.4km/s, T0 =10670K; А -λ=260 nm; В - λ=250 nm; С - λ=230 nm; D - λ=220 nm.
Profiles of absorptions I/I0 and vibrational temperature behind the shock wave front. 100% O2, P1= 2 Torr, V=3.07 km/s, T0=5300 K.
Time histories of vibrational temperature including equilibrium region (Т0=8620 и 9410 К)
Tv-time histories of vibrational temperatures at different initial conditions. A B C D A – 100% O2, p1=2 Torr, V=3.07 km/s, T0=5300 K; B - 100% O2, p1=1 Torr, V=3.4 km/s, T0=6470 K; C- 100% O2, p1=1 Torr, V=3.95 km/s, T0=8620 K; D- 100% O2, p1=0.8 Torr, V=4.44 km/s, T0=10820 K.
Dependence of maximum vibrational temperatureon initial gas temperature Fig. a. Black points are measuredmaximal vibrational temperature. Line 1 is an equilibrium vibrational temperature calculated on the assumption Tv=T before dissociation onset, 100% О2.
Scheme of experimental data handling for determination of kinetic coefficients
Determination ofT2, p2, ρ2, γO2, γO-parameters behind the shock front Conservation equations system on the shock discontinuity • Known quantities Molar-mass concentration of О2molecules (mole/g)
Vibrational relaxation of oxygen at T>6000 K • Millikan&Whitesystematics: • Landau&Teller theory, harmonic oscillator, one-quantum transitions: For oxygen: • Park model: state-to-state transition rate coefficients are based on the forced harmonic oscillator model.
Profiles of temperatures, density and O2 concentration (Т0=10820К) The kinetic equation for the O2- concentration can be presented in the form: Here kd=kd(O2-O2)is a rate constant of dissociation near the shock front.
Dissociation rate constant Black and white points are the rate constants measured in conditions of thermal non-equilibrium (Tv≠T) and thermal equilibrium (Tv=T), respectively. Curves: 1 is the data [1], 2is the value k0 recommended in [2] for conditions Tv=T, [1]Baulch D.L., Drysdale D.D., Duxbury J., Grant S.J. 1976. Evaluated Kinetic Data for High Temperature Reactions. Vol.3. [2] Ibraguimova L.B., Smekhov G.D., Shatalov O.P. 1999. Fluid Dynamics. 34:153-157
Numerical modeling - Treanor&Marrone model, 1962 is coupling factor. In our calculations the following values were used as initial version: Baulch et al., 1976; Millikan R.C., White D.R.,1963. Ibraguimova L.B., Smekhov G.D., Shatalov O.P., 2004
Coupling factors • Kuznetsov model takes into account the preferred dissociation from high vibrational levels. Kuznetsov N.M. 1971. Theor. Exp. Chem. 7:22-33 . • Dissociation from both high and low vibrational levels is considered in Macheret-Fridman model. The quantity L has differentexpressions for rate constants under collisions “molecule-molecule” and “molecule-atom”. Sergievskaya A.L., Losev S.A., Macheret S., Fridman A. 1997. AIAA-Paper, 1997-2580.
Testing Kuznetsov model at Т≤6000К 100% O2. Fig. A: P1 =2 Torr, V = 3.07 km/s; Fig.B:P1=1.5 Torr, V = 3.22 km/s; Fig.С: P1= 1.5 Torr, V=3.4 km/s. The curve 1 is calculationusing Kuznetsov model.
Testing Kuznetsov and Macheret-Fridman models at Т>6500K 100% O2; P1=1 Torr, V = 4.13 km/s, Т0=9410 К. Points are measured values TvandT. Calculations using Kuznetsov model, curves: 1-,k0; 2, 2a – , 0.2∙k0 (0.2∙Z) Calculation using Macheret-Fridman model, curve3: , k0.
Vibrational relaxation of oxygen • Millikan&Whitesystematics: • Landau&Teller theory, harmonic oscillator, one-quantum transitions: For oxygen: • Park model: state-to-state transition rate coefficients are based on the forced harmonic oscillator model.
Temperature dependence of vibrational relaxation time . White triangles and points are the experimental data [1, 2], respectively. Black triangles are thedata of present work. Curves А and В are the data of [3] and [4], respectively. CurveC was taken from Park study [5]. [1]Losev S.A. and Generalov N.A. 1962. [2] Bykova N.G., Zabelinskii I.E., Ibraguimova L.B. et al. 2004. [3] Millikan R.C. and White D.R. 1963. [4] Ibraguimova L.B., Smekhov G.D., Shatalov O.P. 2004. [5] Park Ch., 2006.
Conclusions • Measurements of vibrational and translational temperatures behind the front of a shock wave made it possible to ascertain that the vibrational relaxation and dissociation zones are separated at T< 6500 K, and the vibrational-translational equilibrium is attainedbefore the dissociation onset. • 2.At T > 6500 K the vibrational relaxation of molecules proceeds close to the shock front jointly with the dissociation, and the vibrational-translational equilibrium has no time to be attained before the dissociation onset. • 3.The rate constants of oxygen molecule dissociation are determined for the collisions under both thermal equilibrium and thermal nonequilibrium conditions on the temperature range from 6500 to 10800 K. • 4. It is shown that atT > 5000K the vibrational relaxation time of oxygen molecules decelerates by comparison with Millikan&White and Landau&Teller dependences. • 5. It is shown that theoretical models completely describe the measured temperature profiles at temperatures in shock front less 6500 K. However, at the temperatures higher than 7000 K neither of the tested models describes the measured temperature profiles.
References • [1] Kovach E.A., Losev S.A., Sergievskaya A.L. 1995. Models of two-temperature chemical kinetics for description of molecule dissociation in strong shock waves. Chem. Phys. Reports. 14:1353-1387. • [2] Zabelinskii I.E., Ibraguimova L.B., Shatalov O.P., Tunik Yu.V. Experimental study and numerical modeling of profiles of oxygen vibrational temperature in a strong shock wave. Flight Physics. Ser. Progress in Propulsion Physics. - Moscow: Torus Press, 2011 3:71-82. • [3] Thermodynamic properties of individual substances. Reference book. V.1. Bd.2. Ed. by V.P.Glushko. 1978. Moscow. Nauka. 327p. (In Russian). • [4] Baulch D.L., Drysdale D.D., Duxbury J., Grant S.J. 1976. Evaluated Kinetic Data for High Temperature Reactions. Vol.3. London. Butterworths. 593 p. • [5] Ibraguimova L.B., Smekhov G.D., Shatalov O.P. 1999. Dissociation rate constants of diatomic molecules under thermal equilibrium conditions. Fluid Dynamics. 34:153-157. • [6] Treanor C.E., Marrone P.V. (1962) Effect of dissociation on the rate of vibrational relaxation. Phys. of Fluids. 5: 1022-1026. • [7] Kuznetsov N.M. 1971. Kinetics of molecule dissociation in molecular gases. Theor. Exp. Chem. 7:22-33 (in Russian). • [8] Sergievskaya A.L., Losev S.A., Macheret S., Fridman A. 1997. Selection of two-temperature chemical reaction models for nonequilibrium flows. AIAA-Paper, 1997-2580.
References • [9] Millikan R.C., White D.R. Systematics of vibrational relaxation. 1963. J. Chem. Phys. 39:3209-3213. • [10] Losev S.A. and Generalov N.A. 1962. On study of excitation of vibrations and decay of oxygen molecules at high temperatures. Soviet Phys. – Dokl. 6:1081-1085 • [11] Landau L., Teller E. 1936. Theory of sound dispersion. Phys. Zs. Sow. 10:34-43. • [12] Ibraguimova L.B., Smekhov G.D., Shatalov O.P. 2004. On the correct representation of vibrational relaxation time of diatomic molecules at high temperatures. In book "Physics of Extrem States of Matter - 2004". Chernogolovka, p. 97-98.(In Russian). • [13] N.G. Bykova, I.E. Zabelinskii, L.B. Ibraguimova et al. Numerical and experimental study of kinetic processes in atmospheric plasma. Report No 4736. 2004. Institute of Mechanics of Moscow State University, Moscow. 66 p. (In Russian). • [14] Ch. Park. Thermochemical relaxation in shock tunnels. AIAA Paper 2006-0585.
Спектры полных сечений поглощения в системе Шумана-Рунге молекулы О2 для равновесных условий (T = Tv = Tr): 1 - T = 1000 K; 2 - T = 2000 K; 3 - T = 3000 K; 4 - T = 10000 K.
Absorption oscillogramm, λ=230 nm, 100% O2; P1=1Torr; V =4.13 km/s; T0= 9410 K. Radiation signals: 1 - I0is a radiation signal of light source in absence of shock wave, 2 – I is a radiation signal changed by absorption in heated gas behind the shock front. Time resolution Δt = ΔS / V ~ 0.1 μs
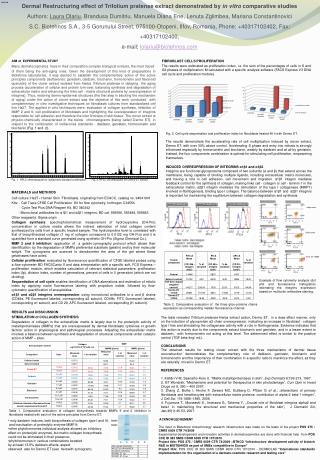
Comparison of measured and calculated absorption cross-sections σ=f(T,Tv)for thermal equilibrium conditions • Bykova N.G., Zabelinskii I.E., Ibraguimova L.B., Shatalov O.P. // Optics and Spectrosc. 2008. V.105. № 5. P. 674. Absorption cross-sections measured in thermal equilibrium conditions (Т=Тк)at T0≤6000 K were compared with theoretical ones. • Bykova N.G., Kuznetsova L.A. // Optics and Spectrosc. 2008. V.105. № 5. P. 668. Theoretical absorption spectra of O2 molecules was simulated forSchumann-Runge system (λ=130-270 нм) in cases of both equal (T=Tv) and unequal vibrational and translational (rotational) temperatures (T≠Tv) at range 1000-10000K.
Determination of vibrational temperature ti → σ1 /σ2 = 2.6 → Tv=3610 K The method of determination of vibrational temperature was described in following works: 1. Zabelinskii I.E., Ibraguimova L.B., Shatalov O.P., Fluid Dynamics, 2010, v. 45( 3). P.485-492. 2. I.E. Zabelinskii, L.B. Ibraguimova, O.P. Shatalov, Yu.V. Tunik. CD Proceedings of 3th European Conference for Aero-Space Sciences (EUCASS), 6-9 July 2009, Versailles, France.