Download
1 / 78
790 likes | 956 Views
N.K. Tovey ( 杜伟贤 ) M.A, PhD, CEng, MICE, CEnv Н.К.Тови М.А., д-р технических наук Energy Science Director C Red Project HSBC Director of Low Carbon Innovation. N.K. Tovey ( 杜伟贤 ) M.A, PhD, CEng, MICE, CEnv Н.К.Тови М.А., д-р технических наук Energy Science Director C Red Project

E N D
N.K. Tovey (杜伟贤) M.A, PhD, CEng, MICE, CEnv Н.К.Тови М.А., д-р технических наук Energy Science DirectorCRedProject HSBC Director of Low Carbon Innovation N.K. Tovey (杜伟贤) M.A, PhD, CEng, MICE, CEnv Н.К.Тови М.А., д-р технических наук Energy Science DirectorCRedProject HSBC Director of Low Carbon Innovation Wind Energy NBS-M016 Contemporary Issues in Climate Change and Energy 2010 • Renewable Energy • Solar Energy • Wind Energy Lecture 1 Supplementary Solar
22. Renewable Energy • Renewable energy sources may be divided into three categories • 1) Solar - • a) direct • b) indirect - e.g. wind, waves., biomass • 2) Lunar - tidal • 3) Geothermal • Together direct and indirect solar sources are ~ 50000 times the geothermal resource, and _~ 500000 times the lunar source. • See section 4 of the notes for the magnitudes of the different sources. • Energy from Waste often included as Renewable Energy. • Sometimes such energy is linked with biomass. • ?? an alternative Energy Source. • PET COKE is often used in the Cement industry and also Iron and Steel as an alternative fuel. • BUT it has a higher CARBON FACTOR than even coal!!!
23. Solar Energy (1) Solar Radiation Deliberate Collection Incidental Collection Focussed Architectural Design Unfocussed Flat Plate Collectors Parabolic or tracking Collectors with or without extra lenses/mirrors Biomass Water heating PV generators Passive Heating / Cooling Solar Ponds Hot Water / Electricity Generation High Temperature Steam Generation Central Solar Power Stations Greenhouses/ crop drying
23. Solar Energy (2) • Passive Heating - Trombe Wall B C B C E E D D A A Which flaps should be open/closed and when? Summer Operation A, E and D open, B and C closed Winter Operation A, C and D open, B and E closed
23. Solar Energy (3) • Passive Cooling Damp Cloths Cooling by evaporation – also Swamp Box Air conditioner
23. Solar Energy (4) Dual circuit solar cylinder indirect solar cylinder
23. Solar Energy (5) Solar Pump Normal hot water circuit Solar Circuit Dual circuit solar cylinder
23. Solar Energy (6) Solar Collectors installed 27th January 2004 Annual Solar Gain 910 kWh 8
23. Solar Energy (7) Output from a 2 panel Solar Thermal Collector
23. Solar Energy (8) Tubular Collectors Higher Reflectivity Lower Reflectivity
23. Solar Energy (9) Centralised Solar Power Steam generation Incoming Radiation
23. Solar Energy (10) Centralised Solar Power Solar 2 developed from Solar 1 at Bairstow California 10 MW Capacity
23. Solar Energy (11) Centralised Solar Power PS10 Solar Tower Seville, Spain 11 MW Capacity
23. Solar Energy (12) Centralised Solar Power Andasol Solar Power Station – Grenada Spain 50 MW World’s first commercial station – commissioned in November 2008
23. Solar Energy (13) Photovoltaics Incoming Solar Radiation N type layer is doped with a valence 5 element – e.g. arsenic N type P type layer is doped with a valence 3 element – e.g. gallium P type Electrical Load
23. Solar Energy (14) Photovoltaics Mono - crystalline ~ 80 – 100 kWh / sqm / annum Thin film ~ 60 – 70 kWh / sqm / annum • Poly - crystalline • ~ 60 – 80 kWh / sqm / annum Typical test bed efficiencies 15 – 16% for mono-crystalline - theoretically up to 30%, but practical efficiencies after inversion in real situations ~ 10 – 12%
23. Solar Energy (15) Photovoltaics Solar Sundial for a location in southern UK Takes account of solar availability
ZICER Building Photo shows only part of top Floor • Mono-crystalline PV on roof ~ 27 kW in 10 arrays • Poly- crystalline on façade ~ 6.7 kW in 3 arrays 19
Performance of PV cells on ZICER Output per unit area Little difference between orientations in winter months Load factors Façade: 2% in winter ~8% in summer Roof 2% in winter 15% in summer 20
Performance of PV cells on ZICER All arrays of cells on roof have similar performance respond to actual solar radiation The three arrays on the façade respond differently 21
120 150 180 210 240 Orientation relative to True North 22
Arrangement of Cells on Facade Individual cells are connected horizontally Cells active Cells inactive even though not covered by shadow If individual cells are connected vertically, only those cells actually in shadow are affected. As shadow covers one column all cells are inactive 24 24 24 24
Ways to Respond to the Challenge: Technical Solutions: Solar Photovoltaic Photovoltaic cells are still expensive, but integration of ideas is needed. Output depends on type but varies from ~70kWh to ~100kWh per square meter per year. Average house in Norwich consumes ~ 3535 kWh per year 25
Average Domestic Consumption of Electricity • UK average is 4478 kWh per year at a cost of around £530 • Norwich average is 3535 kWh and is 6th best out of 408 Councils • Uttlesford average is 5884 kWh and is 396th out of 408 • NK Tovey’s average in a four bedroomed detached house is • <2250 kWh per year to 31st March 2010 [50% of National Average] • a reduction of 25% compared to on 18 months ago. • On average • Norwich – consumers will be paying 79% of National average • Uttlesford – consumers will be paying 131% of National average
Average Domestic Consumption of Electricity • Consumption of Local Authority Districts in 1080, • % cost compared to National Average • Rank position in UK out of 408 Local Authorities In Norwich average household emits 1.9 tonnes of CO2 In Uttlesford 3.1tonnes of CO2
Supplementary Solar Slidesfrom presentation given by N.K. Tovey on 5th February in Newmarket
Technical Solutions: Solar Thermal Energy Up to 15 installations were monitored at 5 miute intervals for periods up to 15 months Mean Monthly Solar gain for 11 systems 3 panel systems Some 2 panel systems captured twice the energy in summer months as other 2 panel systems.. 29
The Broadsol Project • Three panel systems captured only 13% more energy compared to two panel systems • Effective use is not being made of surplus in summer 30
Measured Overall System Efficiencies 2 panel 3 panel System Efficiency of 2 panel systems is generally higher than 3 panel systems 31
Tilt Angle variations are not significant in region 0 – 45o Optimum orientation in East Anglia is SSW South West is as almost as good as South 32 32
More Solar Energy is Collected when Hot Water use is greater. Sky became hazy at ~ 11:00 Substantial hot water demand at 13:30 Normal heat loss from tank if there had been no demand shown in black 1.157 kWh extra heat collected. Note: further demand at 18:30 leading to further solar collection. Even more solar collection would have been possible had collector been orientated SW rather than S 1.164kWh 0.911kWh 1.157kWh 0.083kWh BS27: 15/05/2004 33
Technical Issues requiring awareness raising: Solar Thermal Energy captured when combined with central heating • Tank with small residual hot water at top of tank in early morning • If Central Heating boiler heats up water – less opportunity for solar heating. Zone heated by solar energy 34
Technical Issues requiring awareness raising: Solar Thermal Energy Tank with small residual hot water at top of tank in early morning No hot water provided by central heating boiler. Gain from solar energy is much higher. More solar energy can be gained if boiler operation is delayed. Boiler ON/OFF times should be adjusted between summer and winter for optimum performance 35
Peak Cell efficiency is ~ 9.5%. Average efficiency over year is 7.5% Efficiency of PV Cells Poly-crystalline Cell Efficiency Mono-crystalline Cell Efficiency • Peak Cell efficiency is ~ 14% and close to standard test bed efficiency. • Most projections of performance use this efficiency • Average efficiency over year is 11.1% Inverter Efficiencies reduce overall system efficiencies to 10.1% and 6.73% respectively 36
Technical Solutions: Integrated use of PV generated energy • Inverters are only 91% efficient • Computers and other entertainment use DC. Power packs are inefficient • LED lighting can use DC • Need an integrated approach – houses with both AC and DC with heat recovery from central inverter/rectifier? 37
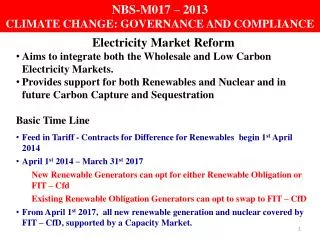
Benefits from Feed In Tariffs: From 1st April 2010 Tariffs for Generation In addition it is proposed that electricity exported will benefit from an export tariff which is currently proposed at 3p*** per kWh Revised Tariffs as published by DECC on 1st February 2010 38
A solar system is designed to make a house self sufficient in space heating requirements throughout the summer from March onwards. Graph shows the profile of solar radiation throughout the day. The collector is 40% efficient. The mean external temperature is 6.9oC and the heat loss rate is 300 WoC-1. If the thermostat setting is 20oC and incidental gains amount to 1.5 kW, what area of collector is required? What volume of heat store is required if water is used operating over a range of 25oC? Solar worked example Daily solar energy provision = 2 x (10 + 50 + 175 + 325 + 485 + 575) * 3600 * 0.4 = 4.6656 MJ / sqm / day
Incidental gains Collector area Solar worked example – part 2 Daily solar energy provision = 4.6656 MJ / sqm / day Balance (base) temperature = 20 – 1500 / 300 = 15oC Heat Requirement = 300 * (15 – 6.9) = 2430 Watts Over a day 2430 * 86400 = 209.952 MJ are required. Area of collector = 209.952 / 4.6656 = 45 sq m To find the storage volume required it is necessary to replot the graph to indicate the total actual amount of solar energy available each hour – i.e. multiply values by 45 and 0.4 efficiency
Between midnight and 06:00 and 18:00 - 24:00, no solar energy. • Heat withdrawn from the store to make up for the heat loss of 2430 watts. = 2430 * 12 * 3600 / 1000000 = 104.976 MJ • In addition, partial withdrawal: • (2430 – 180) = 2250 Watts between 06:00 - 07:00 and 17:00 -18:00 • (2430 – 900) = 1530 watts between 07:00 – 08:00 and 16:00-17:00. • i.e. a total of 2* (2250 + 1530) * 3600/1000000 = 27.216 MJ Total Store = 104.976 + 27.216 = 132.192 MJ/day 1 cu metre water weighs 1000 kg so operating over 25oC 1 cu metre stores 4.1868 * 25 = 104.67MJ Total volume of water required = 132.192 / 104.67 = 1.26 cum.
N.K. Tovey (杜伟贤) M.A, PhD, CEng, MICE, CEnv Н.К.Тови М.А., д-р технических наук Energy Science DirectorCRedProject HSBC Director of Low Carbon Innovation N.K. Tovey (杜伟贤) M.A, PhD, CEng, MICE, CEnv Н.К.Тови М.А., д-р технических наук Energy Science DirectorCRedProject HSBC Director of Low Carbon Innovation Lecture 1 Lecture 3 NBS-M016 Contemporary Issues in Climate Change and Energy 2010 • Wind Energy • Tidal Energy Lecture 2
Early Wind Power Devices • C 700 AD in Persia • used for grinding corn • pumping water • evidence suggests that dry valleys were “Dammed” to harvest wind
Early Wind Turbines Charles Brush 1.25 MW Turbine in Vermont (1941) 12 kW Wind Turbine in Cleveland, Ohio (1888) Gedser Wind Turbine, Denmark (1957) • First wind turbine built in 1887/8 by Charles Brush • see article about this wind turbine: http://www.windpower.org/en/pictures/brush.htm
Wind Map of Western Europe: wind resource at 50m above surface Sheltered Open Coast Open sea Hills Dr J. Palutikof
Wind map of UK • The detailed picture is much more complex: • Topography • Distance from sea • Roughness • Obstacles
Wind Energy: Fundamentals (1) A V Energy from wind is obtained by extracting KINETIC ENERGY of wind. Kinetic Energy = 0.5 mV 2 where V is velocity of wind (m s-1), m (kg) is the mass of air flowing through an area each second = density x area x distance travelled in 1 sec = A V where is the density of air, and A is the cross sectional area of air flowing through This represents the theoretical energy available in the wind.
Wind Energy: Fundamentals (2) V A Rated Output Cut in speeds Cut out speeds Modern Wind Turbines can achieve a practical efficiency of around 75% which means that a maximum overall efficiency of around 40 – 42% can be achieved. Cut in speeds are around 4 – 5.5 ms-1 Rated output is achieved at around 12 ms-1 Cut out speed ~ 22 – 25 ms-1 Theoretically it is only possible to extract 59.26% of the Kinetic energy in the wind – This is known as the BETZ EFFICIENCY.
Wind Energy: Fundamentals (3) Optimum Efficiency is obtained with a Tip Speed Ratio i.e. the velocity of the blade tip is several times that of the wind. Typically TSR is around 6 but it does depend on number of blades. It is approximately given by where n is number of blades This means that smaller machines will need to turn faster that large machines to achieve the optimum TSR For further details: Seehttps://netfiles.uiuc.edu/mragheb/www/NPRE%20498WP%20Wind%20Power%20Systems/Optimal%20Rotor%20Tip%20Speed%20Ratio.pdf
Wind Energy: Fundamentals (4) The Park Effect The efficiency will be reduced if there is turbulence and if turbines are placed too close to each other a significant reduction in output can occur - e.g. Wind Farms in California in 1980s