Download

1 / 31
310 likes | 513 Views
Energy and Climate Change. AWMA – Mobile, AL. Ken Mitchell, Ph.D. Senior Climate Change Advisor U.S. Environmental Protection Agency Atlanta, GA. Today’s points of discussion…. Climate Change – what is it, why do we care about it? What is the connection to energy?

E N D
Energy and Climate Change AWMA – Mobile, AL Ken Mitchell, Ph.D. Senior Climate Change Advisor U.S. Environmental Protection Agency Atlanta, GA
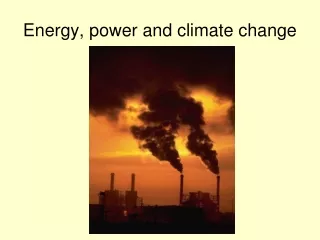
Today’s points of discussion…. • Climate Change – what is it, why do we care about it? • What is the connection to energy? • What are people doing about climate change – regulatory, political, and voluntary initiatives • More about the Climate-Energy Connection in the Southeast and what can be done to address it
Some important terms…. • Climate change refers to any significant change in measures of climate (such as temperature, precipitation, or wind) lasting for an extended period (decades or longer). • Global warming is an average increase in the temperature of the atmosphere near the Earth's surface and in the troposphere, which can contribute to changes in global climate patterns. • Weather is the atmospheric condition at any given time or place. “Climate is what you expect (e.g. cold winters) and weather is what you get (e.g. a blizzard).”
The Greenhouse Effect Some of the infrared radiation passes through the atmosphere, and some is absorbed and re-emitted in all directions by greenhouse gas molecules. The effect of this is to warm the earth’s surface and the lower atmosphere. Some solar radiation is reflected by the earth and the atmosphere SUN Solar radiation passes through the clear atmosphere Most radiation is absorbed by the earth’s surface and warms it Atmosphere Infrared radiation is emitted from the earth’s surface
What are Greenhouse Gases (GHGs)? • Chemicals like… • carbon dioxide (CO2) • methane (CH4) • nitrous oxide (N2O) • hydrofluorocarbons (HFCs) • perfluorocarbons (PFCs) • sulfur hexafluoride (SF6)
U.S. GHG Allocated to Economic Sector Inventory of U.S. Greenhouse Gas Emissions and Sinks: 1990-2007 (U.S. EPA, 2009). All GHGs. Excludes land use, land-use change and forestry, emissions from U.S. territories and international bunker fuels. Technical Support Document for EPA Endangerment Finding, 2009
Climate Change and Energy at EPA • An EPA Priority • Reducing greenhouse gases (GHG) is a top priority for Administrator Jackson • Some key actions taken: • Endangerment Finding • Light-Duty Vehicle GHG Emissions Standards and CAFE Standards • GHG permitting requirements on large industrial facilities (Tailoring Rule) • Mandatory Reporting • Renewable Fuels Standard • Carbon Capture & Sequestration • A variety of voluntary and other initiatives
EPA’s Endangerment Finding • Endangerment Finding: Current and projected concentrations of the six key well-mixed GHGs in the atmosphere threaten the public health and welfare of current and future generations • Cause or Contribute Finding: The combined emissions of these well-mixed GHGs from new motor vehicles and new motor vehicle engines contribute to the greenhouse gas pollution which threatens public health and welfare • Final Rule published in Federal Register December 15, 2009 • Greenhouse Gases (GHGs) • Carbon Dioxide (CO2) • Methane (CH4) • Nitrous Oxide (N2O) • Hydrofluorocarbons (HFC) • Perfluorocarbons (PFC) • Sulfur Hexafluoride (SF6)
Key Findings • Human Activity Has Increased GHGs in the Atmosphere • The Climate is Warming • Human Greenhouse Gas Emissions are Causing Climate Change • Climate Change is Projected to Continue During This Century Technical Support Document for EPA Endangerment Finding, 2009
Mobile Source GHG/CAFE Proposed Rule • First national GHG emissions standards under the Clean Air Act • Satisfies requirements under both Federal programs and the standards of California and other states • Applies to passenger cars, light-duty trucks, and medium-duty passenger vehicles, covering model years 2012 through 2016 • Meet an estimated combined average emissions level of 250 g CO2 per mile in model year 2016, equivalent to 35.5 mpg if the automotive industry were to meet this CO2 level all through fuel economy improvements • These standards will cut greenhouse gas emissions by an estimated 960 million metric tons and 1.8 billion barrels of oil over the lifetime of the vehicles sold under the program (model years 2012-2016) • Final rule signed April 1, 2010 May 21 – President Obama issues memo to EPA/DOT to increase fuel efficiency/reduce GHG emissions from Model Year 2014 through 2018 medium- and heavy duty trucks. Also calls for additional set of GHG emissions standards for cars/light trucks for MYs 2017 and beyond.
Funding (DERA + ARRA Grants): $51M Leveraged Funds: $300M Lifetime tons of emissions reduced (>450 projects): NOx 22,228 PM 2,308 HC 46,001 CO 9,376 CO2 184,071 www.southeastdiesel.org
What about stationary sources of GHGs? • “Tailoring Rule” • Final Rule issued May 13, 2010 • Establishes thresholds for GHG emissions • Define when permits under the New Source Review Prevention of Significant Deterioration (PSD) and title V Operating Permit programs are required for new and existing industrial facilities • “Tailors" the requirements of these CAA permitting programs to limit which facilities will be required to obtain PSD and title V permits • Facilities responsible for nearly 70 percent of the national GHG emissions from stationary sources will be subject to permitting requirements • Includes the nation's largest GHG emitters - power plants, refineries, and cement production facilities • Emissions from small farms, restaurants, and all but the very largest commercial facilities will not be covered by these programs at this time
Permitting Steps under the Tailoring Rule 2011 2012 2013 2014 2015 2016 Step 1: Source already subject to PSD “anyway” (tpy CO2e) New source: N/A Modification: 75,000 Step 2: All Stationary Sources (tpy CO2e) New source: 100,000Modification: 75,000 Step 3: Implementation of potential additional phase-in and streamlining options 5-year study: To examine GHG permitting for smaller sources Implementation of rule based on 5-year study Study Complete
GHG Reporting Rule Covered Source Types • Covered GHGs • Carbon Dioxide (CO2) • Methane (CH4) • Nitrous Oxide (N2O) • Hydrofluorocarbons (HFC) • Perfluorocarbons (PFC) • Sulfur Hexafluoride (SF6) • Nitrogen Trifluoride (NF3) • Hydrofluorinated Ethers (HFE) *EPA will not be implementing subpart JJ of the Mandatory GHG Reporting Rule using funds provided in its FY2010 appropriations due to a Congressional restriction prohibiting the expenditure of funds for this purpose. • Expressed in metric tons of carbon dioxide equivalent (mtCO2e) • First report for CY10 • Final Rule Published in Federal Register on October 30, 2009 • Additional source categories proposal (signed 3/22/10) • Technical corrections, clarifying, other amendments proposal (signed 5/27/10) • Confidential business information and data handling requirements proposal (signed 6/28/10)
Renewable Fuels Standard (RFS2) • Revision to current RFS (RFS1) as required by the Energy Independence and Security Act (EISA) • Significant increase in renewable fuels to displace petroleum consumption (36 billion gallons by 2022) • CO2 Lifecycle analysis • Final Rule Signed 2/3/2010 a The 20% criterion generally applies to renewable fuel from new facilities that commenced construction after December 19, 2007.
Figure courtesy: CO2CRC Geologic Sequestration of CO2 • Proposed requirements under Safe Drinking Water Act (SDWA) for the underground injection of CO2 for long-term underground storage • Builds on UIC regulatory framework, with modifications based on the unique nature of CO2 injection • Proposed in Federal Register July 25, 2008
Other Government Efforts • GHG Reduction Target for Federal Operations • Federal Government, the largest energy user in the U.S., will reduce its GHG pollution by 28% by 2020 (2008 as baseline year) • HUD-DOT-EPA Interagency Partnership for Sustainable Communities • An effort to help improve access to affordable housing, more transportation options, and lower transportation costs while protecting the environment in communities nationwide • Re-powering America’s Land • Siting Renewable Energy on Potentially Contaminated Land and Mine Sites • E3: Economy, Energy and Environment • Coordinated federal and local technical assistance initiative to help manufacturers adapt and thrive in a new business era focused on sustainability, including GHGs and energy
Key Federal Legislation • House Climate/Energy Legislation • June 2009: Waxman-Markey passes House • Senate Climate/Energy Legislation • November 2009: Kerry-Boxer approved in Committee • Kerry-Lieberman • Released April 2010 • Reid ‘‘Clean Energy Jobs and Oil Company Accountability Act of 2010’’ • Released July 2010
Some Typical Elements of Climate/Energy Bills • Clean Energy • Energy Efficiency • Clean Transportation • Cap And Trade • Transitioning To A Clean Energy Economy • Climate Change Adaptation
Home Annex I Countries Non Annex I Countries Others Pledge Hotline Australia EU-27 New Zealand Monaco Belarus Norway Russian Federation Canada Switzerland Ukraine Croatia USA Iceland Japan Liechtenstein Africa Asia and Pacific Europe Latin America and the Caribbean West Asia Chile Copenhagen Accord
Some key facts about Region 4…. • Home to 20% of the population (with a large EJ component) • We generated about 23% of electricity in U.S. (burning coal is a primary fuel source) in 2008 • Responsible for about 25% of U.S. CO2emissions (from power production) in 2008 • We use more fuel and drive more miles than any other Region Energy Information Administration Federal Highways Administration U.S. Census Bureau
2008 CO2 Emissions from Power Generation in R4 States Source: Energy Information Administration
So why do we use so much electricity? • Possible reasons include: • Historically low electricity rates • Significant heating and cooling loads that characterize many southern states • Relatively weak energy conservation ethic (based on public opinion polls) • Low market penetration of energy-efficient products (based on purchase behavior) • Lower than average expenditures on energy-efficiency programs Chernova, 2009 (from a 2009 poll by Public Agenda) Energy Efficiency in the South, SEEA, 2010
ACEEE’s 2009 State Energy Efficiency Scorecard Results Source: Eldridge et. al. 2009. http://aceee.org/pubs/e097.htm
Adaptation to Climate Change Impacts • Many concerns for the Southeast…. • Most coastline in the lower 48 states • Large at-risk population • Prone to frequent natural disasters • Significant forestry, agriculture, infrastructure, and ecosystem resources Ocean surface temperature during the peak hurricane season, August through October, in the main development region for Atlantic hurricanes. Higher sea surface temperatures in this region of the ocean have been associated with more intense hurricanes. As ocean temperatures continue to increase in the future, it is likely that hurricane rainfall and wind speeds will increase in response to human-caused warming. US GCRP, 2009
Relative Sea Level Changes on United States Coastlines, 1958 to 2008 Source: Karl et al. (2009) Observed changes in relative sea level from 1958 to 2008 for locations on the United States coast Technical Support Document for EPA Endangerment Finding, 2009
Questions? Ken Mitchell, Ph.D. Climate Change Advisor U.S. EPA; Atlanta, Georgia 404-562-9065 mitchell.ken@epa.gov www.epa.gov/CLIMATECHANGE www.epa.gov/CLEANENERGY