Download
1 / 10
100 likes | 178 Views
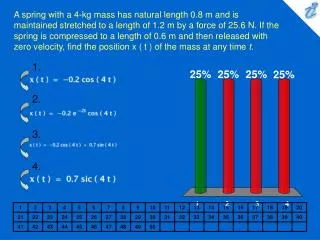
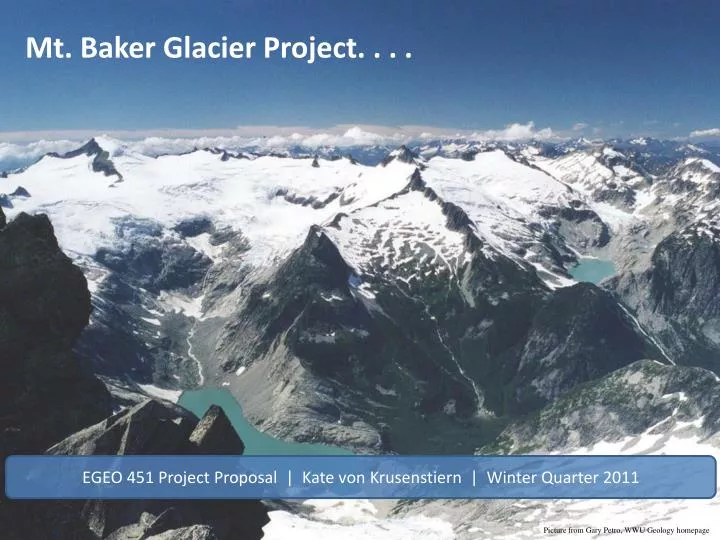
Mt. Baker Glacier Project. EGEO 451 Project Proposal | Kate von Krusenstiern | Winter Quarter 2011. Image from swisseduc.ch. Picture from Gary Petro, WWU Geology homepage. How do you find the area of glaciers of the North Cascades?. How can you calculate the volume of the glaciers?.

E N D
Mt. Baker Glacier Project. . . . EGEO 451 Project Proposal | Kate von Krusenstiern | Winter Quarter 2011 Image from swisseduc.ch Picture from Gary Petro, WWU Geology homepage
How do you find the area of glaciers of the North Cascades? How can you calculate the volume of the glaciers? What is the most effective method to evaluate changes of area and volume of glaciers over historical time? How can these methods be automated and applied to glacier systems worldwide? How do changes in glacier behavior effective affect our lives? How does one best illustrate these changes of glacier behavior?
WHY STUDY GLACIER BEHAIVOR? • Impact on global sea rise • Glaciers as a water resource • Affect on mountain ecosystems • Sources of paleoclimate data, climate change data Image from swisseduc.ch • Glaciers are shrinking all over the world!!!! Image from Jason Racey Image from USGS Wwu Geology Department
PROPOSAL . . . • Create a model that uses basic parameters to calculate the volume of glaciers Digital Elevation Model Glacier Outlines Glacier Flow-lines • Apply the model over a period time to evaluate changes in glacier volume • Study Area: Mt. Baker Washington
Digital Elevation Model • 10m DEM found on the J Drive • Data from USGS, Washington State • Derived from LANDSET data (on J-drive) of Mt. Baker using a Normalized Difference Snow Index (NDSI). • Image processing done in ENVI, raster to polygon done in ArcMap. Glacier Outlines • Hypothetical lines along the glacier indicating glacier velocity. • Generate by looking at surface slope of glaciers with a DEM. Glacier Flow-lines
Normalized Difference Snow Index (h) Band4/Band 5 (Band2+Band 5) (Band 2- Band 5 Band3/Band 5
OUTCOMES. . . (hopeful) Area and volume of glaciers on Mt. Baker for one year Area and volume of glaciers on Mt. Baker over forty years (1970 –current) A model that can be applied to other glacier systems Web-based geo-visualization application of the volume changes!