Download
1 / 4
40 likes | 89 Views
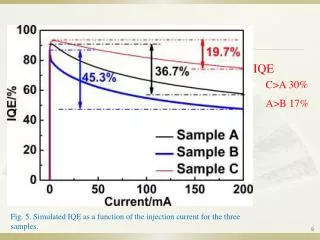
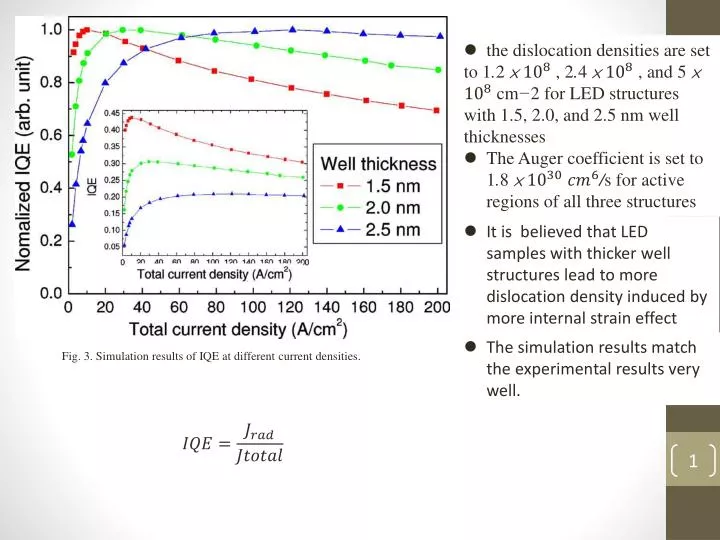
the dislocation densities are set to 1 . 2 × , 2 . 4 × , and 5 × cm − 2 for LED structures with 1.5, 2.0, and 2.5 nm well thicknesses The Auger coefficient is set to 1 . 8 × / s for active regions of all three structures.

E N D
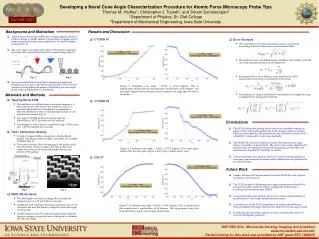
the dislocation densities are set • to 1.2 × , 2.4 × , and 5 × cm−2 for LED structures • with 1.5, 2.0, and 2.5 nm well thicknesses • The Auger coefficient is set to 1.8 × /s for active regions of all three structures • It is believed that LED samples with thicker well structures lead to more dislocation density induced by more internal strain effect • The simulation results match the experimental results very well. Fig. 3. Simulation results of IQE at different current densities.
Fig. 4. Ratios of dislocation recombination rates to total carrier recombination rates, Rdis/Rdis + Rrad + RAuger , and Auger recombination rates to total carrier recombination rates, RAuger/Rdis + Rrad + RAuger, versus total current density. The ratios of dislocation recombination rates are higher than that of Auger recombination rates at low current densities. As current densities increase, ratios of dislocation recombination rates decrease and ratios of Auger recombination rates increase.
Fig. 5. Ratios of nonradiative current densities to total current densities Jnrad/Jtotal and carrier overflow current densities to total current densities Joverflow/Jtotal at different current densities. Jnrad/Jtotal saturates at current higher than 100 A/cm2 . Joverflow/Jtotal increases as total current densities increase.
TABLE IVARIATIONS OF IQE, RATIO OF NONRADIATIVE CURRENT DENSITIES TOTOTAL CURRENT DENSITIES (JNRAD /JTOTAL ) AND RATIO OF CARRIEROVERFLOW CURRENT DENSITIES TO TOTAL CURRENT DENSITIES(JOVERFLOW /JTOTAL ) IN DIFFERENT CURRENT DENSITY RANGES


![Fig. 3. Train of pulses with two different periods [3].](https://cdn1.slideserve.com/3253865/slide1-dt.jpg)