Download
1 / 28
280 likes | 359 Views
GENETIC STUDIES OF C-MYC ONCONGENE AND ROR1 GENE OVEREXPRESSION IN EPENDYMOMAS. YUEMIN DING Neuro-oncology Group Department of Molecular Neuroscience Institute of Neurology Queen Square, London Supervisor: Dr Tracy Warr. BACKGROUND.

E N D
GENETIC STUDIES OF C-MYC ONCONGENE AND ROR1 GENE OVEREXPRESSION IN EPENDYMOMAS YUEMIN DING Neuro-oncology Group Department of Molecular Neuroscience Institute of Neurology Queen Square, London Supervisor: Dr Tracy Warr
BACKGROUND • Ependymomasare glial tumors that arise from the ependymal lining of the ventricular system of the CNS. • They represent the third most frequent brain tumor in children. (Hamilton RL et al. 1997) • The genetic events that contribute to the pathogenesis of paediatric ependymoma are poorly defined. (Ward S et al. 2001)
BACKGROUND Previous finding of our group • The expression of >12,000 genes in a set of 11 ependymoma samples were determined using oligonucleotide micrarrays analysis. Oncogene c-myc and gene ROR1 were identified to be highly expressed in the tumour samples. • Previous experiments failed to show extra copies of c- myc gene in ependymomas by comparative genomic hybridization (CGH) and fluorescence in situ hybridization (FISH).
BACKGROUND c-myconcogene CHR # 8 c-Myc Cellular processes apoptosis Cell growth proliferation differentiation
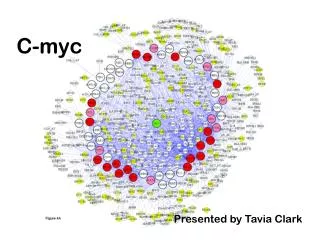
BACKGROUND c-Myc c-Myc c-Myc c-Myc c-Myc ! c-Myc c-Myc c-Myc c-Myc c-Myc — c-myc has emerged as a central oncogenic switch in many human cancers.(Stella Pelengaris 2002)
BACKGROUND Mechanisms lead to gene overexpression • Chromosome duplication • Gene amplification • Point mutation • Regulators dysfunction
A - T C - G G - C A - T T - A A - T C - G G - C G - C T - A overexpression of normal product gene amplification point mutation chromosome duplication
overexpression of normal product Loss of function mutation
BACKGROUND Previous finding of our group • The expression of >12,000 genes in a set of 11 ependymoma samples were determined using oligonucleotide micrarrays analysis. Oncogene c-myc and gene ROR1 were identified to be highly expressed in the tumour samples. • Previous experiments failed to show extra copies of c- myc gene in ependymomas by comparative genomic hybridization (CGH) and fluorescence in situ hybridization (FISH).
HYPOTHESIS The regulator upstream in the c-Myc pathway was abnormal or dysfunctional, eg. loss of function mutation in MM-1.
BACKGROUND Oncogene WNT5A Receptor tyrosine kinase-like orphan receptor 1 (ROR1) FRZ: frizzled module Wnt pathway
HYPOTHESIS ROR1 plays a role in the pathogenesis of ependymomas partially mediated through Wnt-ROR pathway.
AIMS • To investigate the mutation status of the MM-1 gene, which may play a role in the development of ependymomas by deregulating c-myc expression. • To identify the association between the genetic changes of the ROR1 gene and the pathogenesis of ependymomas via Wnt pathway.
Ependymoma case information (sourse: cell culture) Key to table: IN1: Institute of Neurology assigned number Age2: Age in years at diagnosis Sex3: M = male; F = female Grade4: SE = subependymoma; E = ependymoma; AE = Anaplastic ependymoma P/R5: P = primary sample; R = recurrent sample Survival6: survival in months from date of diagnosis Gains7 and losses7: detected by CGH MATERIALS AND METHODS • Tumour specimens • PCR/RT-PCR • SSCP analysis • DNA sequencing
MATERIALS AND METHODS • Tumour specimens • PCR/RT-PCR • SSCP analysis • DNA sequencing
MATERIALS AND METHODS • Tumour specimens • PCR/RT-PCR • SSCP analysis • DNA sequencing
1 2 3 4 MATERIALS AND METHODS • Tumour specimens • PCR/RT-PCR • SSCP analysis • DNA sequencing
Protocol Search the Genomic Database and design the primers Extract DNA from frozen cell cultures of ependymoma samples Amplify target gene by PCR technique Detect mutations by SSCP analysis Direct DNA sequencing
A B Fig 1 RT-PCR studies of c-myc. cDNAs were synthesized from RNA of the tumour samples and the normal brain (CC). β-actin was used as the internal control. DNA marker used is the 100bp ladder. c-myc was overexpressed in tumour samples compared with the CC. Fig. 2 Representative results of SSCP analysis of MM-1. Lanes 1–10, samples of ependymomas. A, MM-1 exon 4-5; B, MM-1 exon 6. Arrowhead highlights abnormal migrating SSCP bands. RESULTS MM-1 Expression level of c-Myc SSCP analysis of MM-1 DNA sequencing of MM-1
RESULTS ROR1 Expression level of ROR1 SSCP analysis of ROR1 DNA sequencing of ROR1
Fig. 3 RT-PCR analysis of ROR1. cDNAs were synthesized from RNA of the tumour samples and the normal brain (CC). β-actin was used as the internal control. DNA marker used is the 100bp ladder. Note ROR1 was overexpressed in tumour samples compared with CC. RESULTS
A B Fig. 4 Representative results of SSCP analysis of ROR1. Lanes 1–11, samples of ependymomas. A, ROR1 exon 7; B, ROR1 exon 8. Arrowhead highlights abnormal migrating SSCP bands.
3008 For 3008 Rev 2941 For 2941 Rev A B Fig. 5 Sequence confirmation of mutations identified by SSCP analysis (ROR1 gene). Black arrows indicate the heterozygous C → T mutation in exon 7 of the ependymoma samples, which were confirmed in both sequencing reactions. (A, sample IN3008; B, sample IN2941)
1258 For 2682 For 1258 Rev 2682 Rev 2443 For 2443 Rev A C B Fig. 6 Sequence confirmation of mutations identified by SSCP analysis (ROR1 gene). Black arrows indicate the heterozygous (A and B) or homozygous (C) A → G mutation in exon 8 of the ependymoma samples, which were confirmed in both sequencing reactions. (A, sample IN1258; B, sample IN2443; C, IN2682)
RESULTS Table 1 Sequence changes in the ROR1 gene
NM_005012.1 [1p32_p31] 937 aa 451: V→V 348: T→T Immunoglobulin domain (72 – 133) FRZ domain (160 – 297) Kringle domain (313 – 391) Phabdovirus spike glycoprotein (411 – 457) Protein kinase domain (473 – 746) Fig. 4.2The structures of ROR1 and SNP location. The silent mutation on codon 348 was located at Kringle domain and the other mutation on codon 451 was at Phabdovirus spike glycoprotein.
CONCLUSION • We failed to detect mutations in MM-1 in ependymomas by DNA sequencing. But it didn’t preclude the possibility that mutations in MM-1 abolished its suppressor function, which lead to c-Myc overexpression, because loss of function mutations may have been missed in the present sequencing analysis. • Two silent mutations were found in ROR1 but they present little relevance in the Wnt pathway in ependymomas. Association of these mutations in ROR1 to cancer risk require further studies.