Download
1 / 28
290 likes | 383 Views
Operating Window Experiments. C. F. Jeff Wu and V. Roshan Joseph. Department of Statistics University of Michigan Ann Arbor, MI, USA. To appear in Journal of Quality Technology, 2002 Available in http://www.stat.lsa.umich.edu/~jeffwu/. Outline. Paper Feeder Example SN Ratio

E N D
Operating Window Experiments C. F. Jeff Wu and V. Roshan Joseph Department of Statistics University of Michigan Ann Arbor, MI, USA To appear in Journal of Quality Technology, 2002 Available in http://www.stat.lsa.umich.edu/~jeffwu/
Outline • Paper Feeder Example • SN Ratio • Probability of Failure Modeling • Performance Measure • Modeling and Optimization • Generalized Performance Measure • Sequential Design/Estimation • Application to Real Data • Summary
Paper Feeder Example • Two failure modes • Misfeed : fails to feed a sheet • Multifeed: Feeds more than one sheet
Objective: Minimize both misfeed and multifeed • through parameter design optimization. • Approach 1 • Feed, say, 1000 sheets at different design settings • Observe # of misfeeds and # of multifeeds • Choose a design setting to minimize both • Problems: • Large sample size required to get reasonable power for • statistical tests • Conflicting levels: design settings that minimizes misfeeds • tend to increase multifeeds • Difficult to distinguish between two design settings
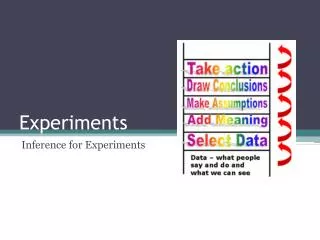
Approach 2 • Failures are extremities of certain functional characteristics • Identify functional characteristics (continuous variables) that • relates to misfeed and multifeed • Do nominal-the-best optimization on these characteristics Example Misfeed : Roller-to-paper friction force Multifeed : Paper-to-paper friction force
Advantages (Approach 2): • More information contained in continuous variables than • in categorical variables • Better understanding about the functioning of the system • Optimization is easier • Problems: • Sometimes not easy to identify the right functional • characteristics • Sometimes difficult to measure due to inadequate or • expensive measurement system An Alternative Approach: Operating Window
Operating Window Operating window is defined as the boundaries of a critical parameter at which certain failure modes are excited. • Clausing (1994), Taguchi (1993). • Approach: • Identify a critical parameter: low values of which lead to • one failure mode and high values lead to the other failure mode • Measure the operating window at different design settings • Choose a design to maximize the operating window
Paper feeder example continued Stack force is a critical parameter and is easy to measure. A small force leads to misfeed and a large force leads to multifeed. misfeed operating window multifeed 0lu stack force (l, u): operating window Stack force: operating window factor
Process/ Product Failure or defect type 1 2 Operating window factor Wave soldering Voids Bridges Temperature Resistance welding Under weld Expulsion Time Image transfer Opens Shorts Exposure energy Threading Loose Tight Depth of cut Picture printing Black Blur Water quantity Medication No effect Side effect Dosage Examples
Notes: • There are no clear boundaries separating the failure modes • The boundaries of operating window are random • They are defined with respect to a threshold failure rate • For example: • l = force at which 50% misfeed occurs • u = force at which 50% multifeed occurs
Effect of Noise Factors N1: 0 N2: 0 N3: 0 Operating window • The two failure modes can be minimized by keeping the • OW factor at the center of the operating window • A large operating window then corresponds to a robust system • Achieving robust design maximizing operating window
Optimization • Control factors: wrap angle, belt tension, radius of retard roll,… • Noise factors : paper weight and type, alignment errors,… • Determine l and u for several control and noise settings • Perform two-step optimization • Find a control factor setting to maximize the • signal-to-noise ratio 2.Adjust OW factor to the middle of the operating window
SN Ratio • Developed at Fuji Xerox • misfeed is eliminated if l= 0 • multifeed is eliminated if u = l is STB: u is LTB: • Then
Probability of failure modeling X = set of control factors N = set of noise factors M = operating window factor Probability of failure due to defect type 1: Probability of failure due to defect type 2: = failure threshold (such as 50%)
Assumed model: Reparameterized as
Performance Measure • If p is the fraction rejection, then the number of extra units to • produce to get a non-defective product has a geometric • distribution with mean . • Loss: • Substituting (*), • Expected loss: • We can set M to minimize the expected loss
EL at M=M*, Performance measure: PM can be estimated by its sample analog, which is the same as the SN Ratio.
Note: • Thus is a composite measure for doing • the following jobs: • Minimize E(l) • Minimize Var(l) • Maximize E(u) • Minimize Var(u) Thus operating window optimization is much more than just widening the operating window
Modeling and Optimization Fit • Find • 2. Adjust • Special case: single noise level, • Maximize • 2. Adjust
Generalized Performance Measure • As , it becomes • is the operating window • is the width of operating window in log scale • Noise factor compounding
Sequential Design/Estimation • Fixed design : Use two logistic regressions • Sequential design: Use logit-MLE method of Wu (1985, JASA) Suppose after k experiments we have the data where y is the number of failures (say misfeed) in a sample of size m. Then choose Ying and Wu (1997, Statistica Sinica)
A Real Example • Peace (1993) • Wave soldering process • Two failure modes: solder voids and solder bridges • OW factor: top side board temperature l: topside board temperature at which solder voids stop u: topside board temperature at which solder bridges begin • Five noise levels: board carriers • 15 control factors: design
: failed to identify any significant effects • are similar , which • means the performance measures are not significant to .
Summary • A rigorous statistical foundation • Operating window SN ratio is justified using PerMIA theory under some restrictive modeling assumptions • New and more effective modeling and optimization strategy • Generalized performance measure (GPM) under more general modeling assumptions • Logit-MLE method for sequential design • Superiority of the proposed strategy is illustrated with an example