Download
1 / 20
200 likes | 283 Views
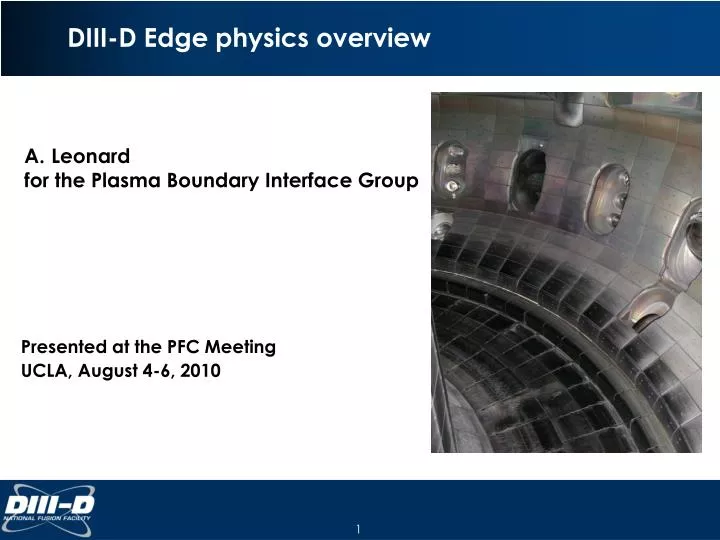
DIII-D Edge physics overview. Leonard for the Plasma Boundary Interface Group. Presented at the PFC Meeting UCLA, August 4-6, 2010. Plasma Boundary Interface 2010 Experimental Topics. PBI was allocated 6.5 days of experimental time Complete Joint Research Target on Boundary heat flux

E N D
DIII-D Edge physics overview • Leonard • for the Plasma Boundary Interface Group Presented at the PFC Meeting UCLA, August 4-6, 2010
Plasma Boundary Interface 2010 Experimental Topics • PBI was allocated 6.5 days of experimental time • Complete Joint Research Target on Boundary heat flux • Complete parameter scan of divertor heat flux width • C-Mod comparison • Measure fluctuation driven radial heat transport in boundary • Fuel Retention and Clean-up • Determine fraction of injected fuel tightly bound in vessel wall • Utilize bake in oxygen to remove fuel co-deposited with eroded carbon • DiMES • Understanding divertor carbon chemical erosion • ITER first wall design issues • Heat flux profile onto startup/rampdown limiters • ELM heat flux into secondary divertor
Boundary Heat Flux Joint Research Task Completed DIII-D Scaling Studies • Completed divertor heat flux width scaling • Power; No dependence • Collisionality; No dependence • Toroidal Field; Weak, or no dependence • Plasma Current; Inverse Dependence • DIII-D Heat flux scaling • lq(cm, midplane) ~ 0.7/Ip (MA) • implies for a diffusive model • Size scaling to be tested across devices • A diffusive model of transport would imply lq∝R1/2 • Further Analysis • Power balance, radiated power • Statistical analysis Heat Flux Width
DIII-D Divertor Heat Flux Compared with Alcator C-Mod C-Mod Shape in DIII-D • A comparison between DIII-D and Alcator C-Mod has been completed • Comparison at same shape and q95 • Density scan matched collisionality • Power scan indicated no heat flux width dependence on power; lends confidence to the noisier data low power for matched edge conditions • Initial C-Mod data has been acquired • Initial estimate of C-Mod width indicates a positive size scaling • Additional analysis with C-Mod underway • Examine size scaling of divertor heat flux widths and upstream profiles to determine consistency with diffusive transport, or a constant gradient
Characteristics of Near SOL Fluctuations to Offer Insight into Heat Flux Transport Mechanisms • Initial set of measurements from midplane Langmuir probe of fluctuation driven heat transport • Initial data set from midplane and X-point probe • Plasma current and density scan • Analysis has only just begun • Examine correlation of turbulence region with divertor heat flux footprint • Dominance of convective transport could indicate interchange-like transport • Planning comparison with turbulence codes
Heat Flux Joint Research Task Summary • A complete parameter scan taken • Initial analysis indicates Ip dominant parameter affecting width • Detailed statistical analysis tasks remain • Upstream profiles acquired • Thomson data unclear if adequate to discern trends • Apply other analysis techniques to Thomson analysis • Upstream probe data yet to be fully compared with divertor heat flux • Size scaling analysis underway • Comparison with C-Mod awaits further C-Mod analysis • Good dataset from JET/DIII-D pedestal comparison also to be analyzed
Goal of Fuel Retention Studies: Determine How Much Fuel Tightly Retained and Clean It Up • Dynamic particle balance indicates most fuel is retained during the plasma ramp-up phase • Successful comparison of ‘static’ to ‘dynamic’ particle balance • Little retention during H-mode phase • A bake after operations removed much of the retained fuel • A day of continuous particle balance preceded and followed by a bake • A successful Oxygen bake • Nothing destroyed(by oxygen) • Rapid restoration of high performance discharges • Removed expected fraction of carbon deposits and deuterium co-deposits
Typical Dynamic Balance has Phases of Retention Phase-2 Phase-3 Phase-I Phase-4 • Phase-I:Pre-fill & Breakdown • No net retention • Phase-2: Ramp-up • Large wall uptake • Dominated by puffing • Phase-3: early H-mode • ELM-free; ne build-up • Net wall release • Phase-4: H-mode steady-state • No measurable retention Phase-4 Phase-4 Phase-4 ΓIN [Torr-L/s] ΓIN [Torr-L/s] Qpump [Torr-L/s] Wall uptake Γwall [Torr-L/s] ∫Γwall [Torr-L] Wall inventory Time (msec) time [sec] time [sec] time [sec]
Pumping Speed Compares Well with Cryopump Regeneration • Careful calibration of dynamic balance diagnostics completed • Multiple shots used for better accuracy in static balance • Allows confidence in dynamic balance results Comparison of Time-resolved vs Shot-integrated Exhausted Particles 2% 0.5% 5% 4% 4% Exhausted Particles [Torr-L] Set #5 Set #1 Set #2 Set #4 Set #3 Set #1 Set #2 Set #3 Set #4 Set #5
1 shot 4 shots 4 shots Complete Run-day Analysis Gives ~ 20% Gas Retention • Static balance used capacitance manometer • Multiple shots to increase accuracy; Error ~ 1.5% • Dynamic balance for whole shot (ramp-up & steady-state H-mode) Cumulative Exhaust vs Injected Particles for a Full Run-day
Vacuum Bake Before and After Single Run-day Used to Deplete and Recover Wall Inventory • Goal is to determine fraction of injected particles than can be easily removed • Pre-operation vacuum bake to deplete recoverable wall inventory • Post-operation vacuum bake after run day to recover loosely bound particles • Limited bake time (i.e., pressure did not turn over)
Vacuum Bake Before and After Single Run-day Returned Large Fraction of Retained Particles • Particle balance summary • Total injected : 2400 [torr-L] • Exhausted: 1010-1140 [torr-L] • Bake released: 1090 [torr-L] • Post-bake retention/total injected • 170-300 [torr-L]/2400 ~7-12% • Would more be released from higher/longer bake? • But co-dep removal starts ~700°C 7-12%
Co-deposited D Could Account for Fuel Left After Vacuum Bake Deposition Pattern in Lower Divertor Region • D left in machine • 1.2-2.1 x10²² D atoms (170-300 Torr-L) • Co-deposition retention estimate: • Net C erosion yields: • Yphys~1%, Ychem~2% • From experiment: ~ 4x10²³ D/s • Assumed D/C ratios: • D/CHard ~ 0.1-0.3; D/CSoft ~ 0.7-1.4 • RetHARD: 1.4-4.3 x 10²¹ D atoms • RetSOFT: 1.5-3 x10²² D atoms = 165sec
Oxygen Bake Goals • Demonstrate an oxygen bake on the DIII-D tokamak and recover high performance plasma operation (with only clean vents). • Assess “collateral damage” to tokamak systems • Operate tokamak systems – Pumps, ECH, ICH • Demonstrate 13C removal on a few inserted tiles • Measure reaction products – RGA and FTIR • Demonstrate removal of 13C from several tiles with a second oxygen bake • DiMES will be only indication that 13C deposited during 10-15 repeat plasma shots • Oxygen Bake • Tiles removed for analysis at start of LTOA
The Heat Flux to the Secondary Divertor is a Significant Concern for ITER Primary divertor • ITER will create secondary divertor when operating at high triangularity • Primary concern is the ELM heat flux which can broader profile than the steady heat flux between ELMs • Local recycling and SOL interaction also a concern due to re-deposition of eroded beryllium and co-deposition of tritium IRTV Secondary divertor BXB Langmuir probes
Secondary divertor heat flux profile between ELMs is relatively broad but peaks at strike point IRTV secondary divertor steady state heat flux • The steady state heat flux in the secondary divertor (between ELMs) is: • peaked at the strike point with typical initial spatial decay • broader and more uneven than typical primary strike point profiles EFIT OSP2 EFIT ISP2
Target plate heat flux profiles during an Elm show large peaks in the far SOL Tile gaps • Large ELM peaks far outside strike-point • Not tied to physical features; tile gaps, or thin layers • Smaller ELMs have narrower profile • Future analysis • ELM power balance; thermocouples, probes • Radial decay of ELM heat flux versus ELM size EFIT OSP2 Δt = 0.2 msec Δt = 0.1 msec Δt = 0.0 msec EFIT OSP2 Δt = 0.3 msec Δt = 1.0 msec
Scaling of Limiter Heat Flux Consistent with ITER Assumptions • Limiter heat flux examined to test ITER first wall design assumptions • Measured widths are within range of assumed scaling, though parameter dependence not observed • λq measured (cm) • λq scaling (cm)