Download
1 / 1
10 likes | 71 Views
An Open Framework for Scalable, Reconfigurable Performance Analysis. UCRL-POST-236200. Trace representation using Power Regular Section Descriptors (PRSDs). GLOBAL REDUCTION. Large Scale MPI Applications Implicit Program Behavior. MPI tasks. Load-annotated

E N D
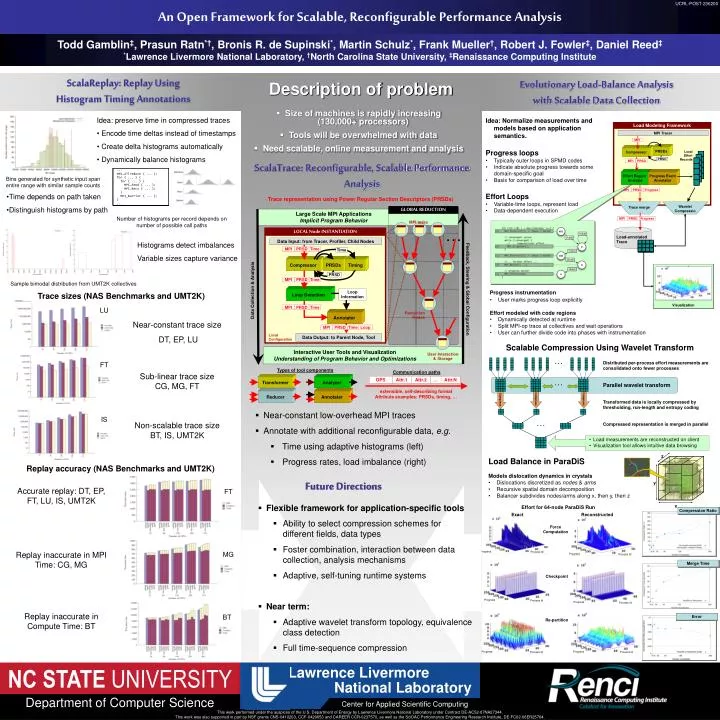
An Open Framework for Scalable, Reconfigurable Performance Analysis UCRL-POST-236200 Trace representation using Power Regular Section Descriptors (PRSDs) GLOBAL REDUCTION Large Scale MPI Applications Implicit Program Behavior MPI tasks Load-annotated Trace … LOCAL Node INSTANTIATION Data Input: from Tracer, Profiler, Child Nodes Local Effort Records MPI PRSD Time Time Compressor PRSDs Timing MPI PRSD PRSD MPI PRSD Time MPI MPI PRSD PRSD Progress Progress Feedback, Steering & Global Configuration Data Collection & Analysis Loop Information Loop Detection MPI PRSD Time Reduction Nodes Annotator Near-constant trace size DT, EP, LU MPI PRSD Time Loop Local Configuration Data Output: to Parent Node, Tool Interactive User Tools and Visualization Understanding of Program Behavior and Optimizations User Interaction& Storage Types of tool components Sub-linear trace size CG, MG, FT Communication paths Transformer Analyzer extensible, self-describing format Attribute examples: PRSDs, timing, … Reducer Annotater Non-scalable trace size BT, IS, UMT2K OPS Attr.1 Attr.2 … Attr.N Compression Ratio Effort for 64-node ParaDiS Run z Exact Reconstructed Progress Process Id Progress Process Id y Merge Time x Error Progress Process Id Progress Process Id Progress Process Id Progress Process Id NC STATE UNIVERSITY Department of Computer Science Todd Gamblin‡, Prasun Ratn*†, Bronis R. de Supinski*, Martin Schulz*, Frank Mueller†, Robert J. Fowler‡, Daniel Reed‡ *Lawrence Livermore National Laboratory, †North Carolina State University, ‡Renaissance Computing Institute ScalaReplay: Replay Using Histogram Timing Annotations Evolutionary Load-Balance Analysis with Scalable Data Collection Description of problem • Size of machines is rapidly increasing(130,000+ processors) • Tools will be overwhelmed with data • Need scalable, online measurement and analysis • Idea: preserve time in compressed traces • Encode time deltas instead of timestamps • Create delta histograms automatically • Dynamically balance histograms • Idea: Normalize measurements and models based on application semantics. • Progress loops • Typically outer loops in SPMD codes • Indicate absolute progress towards some domain-specific goal • Basis for comparison of load over time • Effort Loops • Variable-time loops, represent load • Data-dependent execution Load Modeling Framework MPI Tracer MPI PRSDs Compressor PRSD ScalaTrace: Reconfigurable, Scalable Performance Analysis Effort Region Analysis Progress Event Annotator Bins generated for synthetic input span entire range with similar sample counts • Time depends on path taken • Distinguish histograms by path Trace merge Wavelet Compression Number of histograms per record depends on number of possible call paths Histograms detect imbalances Variable sizes capture variance Visualization Sample bimodal distribution from UMT2K collectives • Progress instrumentation • User marks progress loop explicitly • Effort modeled with code regions • Dynamically detected at runtime • Split MPI-op trace at collectives and wait operations • User can further divide code into phases with instrumentation Trace sizes (NAS Benchmarks and UMT2K) LU Scalable Compression Using Wavelet Transform . . . Distributed per-process effort measurements are consolidated onto fewer processes FT . . . Parallel wavelet transform Compress Compress Compress Transformed data is locally compressed by thresholding, run-length and entropy coding • Near-constant low-overhead MPI traces • Annotate with additional reconfigurable data, e.g. • Time using adaptive histograms (left) • Progress rates, load imbalance (right) IS IS . . . Compressed representation is merged in parallel • Load measurements are reconstructed on client • Visualization tool allows intuitive data browsing Load Balance in ParaDiS Replay accuracy (NAS Benchmarks and UMT2K) • Models dislocation dynamics in crystals • Dislocations discretized as nodes & arms • Recursive spatial domain decomposition • Balancer subdivides nodes/arms along x, then y, then z Accurate replay: DT, EP, FT, LU, IS, UMT2K Future Directions FT • Flexible framework for application-specific tools • Ability to select compression schemes for different fields, data types • Foster combination, interaction between data collection, analysis mechanisms • Adaptive, self-tuning runtime systems • Near term: • Adaptive wavelet transform topology, equivalence class detection • Full time-sequence compression Force Computation Replay inaccurate in MPI Time: CG, MG MG Checkpoint Replay inaccurate in Compute Time: BT BT Re-partition Lawrence Livermore National Laboratory Center for Applied Scientific Computing This work performed under the auspices of the U.S. Department of Energy by Lawrence Livermore National Laboratory under Contract DE-AC52-07NA27344. This work was also supported in part by NSF grants CNS-0410203, CCF-0429653 and CAREER CCR-0237570, as well as the SciDAC Performance Engineering Research Institute, DE-FC02-06ER25764.