Download
1 / 19
190 likes | 340 Views
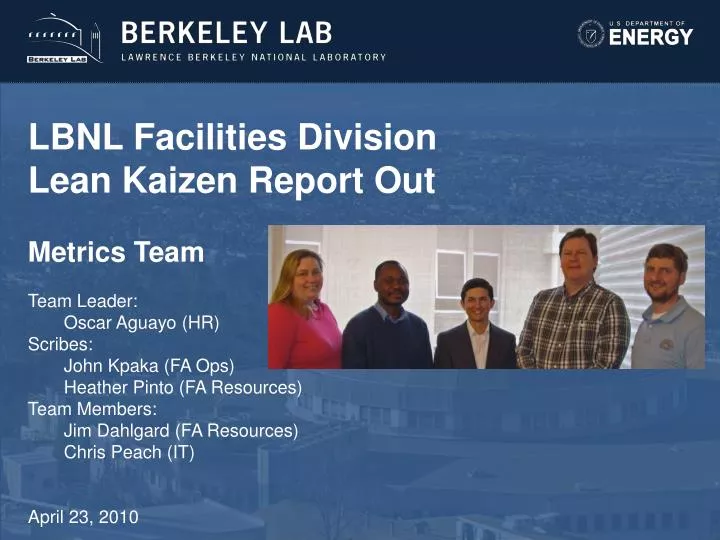
LBNL Facilities Division Lean Kaizen Report Out Metrics Team Team Leader: Oscar Aguayo (HR) Scribes: John Kpaka (FA Ops) Heather Pinto (FA Resources) Team Members: Jim Dahlgard (FA Resources) Chris Peach (IT) April 23, 2010. Background. Lean Training Kaizen teams formed

E N D
LBNL Facilities Division Lean Kaizen Report Out Metrics Team Team Leader: Oscar Aguayo (HR) Scribes: John Kpaka (FA Ops) Heather Pinto (FA Resources) Team Members: Jim Dahlgard (FA Resources) Chris Peach (IT) April 23, 2010
Background • Lean Training • Kaizen teams formed • Metrics Kaizen Team charged with creating Facilities Division metrics • One year process – not easy & needs time
Problem Description Facilities Division does not have clear or consistent performance metrics If you can’t measure, you can’t manage Objectives/Goals • Analyze Facilities Department Metrics • Propose final Facilities Division Metrics • Standardize, Implement, and Sustain Facilities Division Metrics
Analysis/Current Conditions Preliminary Scorecard developed for use by all Departments Scorecard geared for measurements at Department level or lower Need for Dashboard that is more customer focused
Proposed Metrics Customer Lead Time On Time Quality Up Time Customer Survey Resources Labor Cost per Work Order Total Recordable Case Rate Inventory Turnover
Resources – Turnover • Division wide • All terminations (voluntary and involuntary), etc.
Resources – Total Recordable Case Rate • Division wide • Frequency of injury per 100 employees • Drill down by • Severity Indicator (e.g. avg. $400k/yr on injuries) • Days Away & Restricted Time Benchmark
Resources – Inventory Turns • Stores inventory only • Turn ratio = Annualized issues Inventory value
Resources – Inventory Drill Down by Inventory Value • Cash tied up in Stores inventory
Resources – Labor Costs per Work Order • Operations only • Closed projects • Average cost of labor(including overtime)per work order: = Labor cost CM+PM Total count of CM+PM
Quality – Customer Survey • Covers all work orders that produce a customer satisfaction survey • Average for all ratings
Quality – Up Time • Measures up time for all building systems, including mission critical, building critical, and customer impact (e.g. water, elevators) • Not currently being tracked Sample
Customer – Lead Time • CM’s only • Time from customer request to work complete
Customer – Lead Time Drill Down by Supervisor • Closer look for root cause analysis
Customer – On-Time • Covers all work orders • % actual work complete on or before estimated completion date • Based on estimated dates in Maximo OR • Based on SLA agreement (e.g. Transportation 4 days) • Much of this is not currently tracked • Need scheduling system for this Sample
Metrics and Performance Management Performance Agreement Meeting Annual Performance Appraisal Monitor Performance Metrics Regular Feedback Meetings