Download
1 / 37
370 likes | 377 Views
Worldwide incident rates figure 13.1 per million population, 2000. Worldwide incident rates figure 13.1 per million population, 2000. Prevalence of ESRD table 13.a per million population, 2000. Prevalence of ESRD table 13.a per million population, 2000 (cont.).

E N D
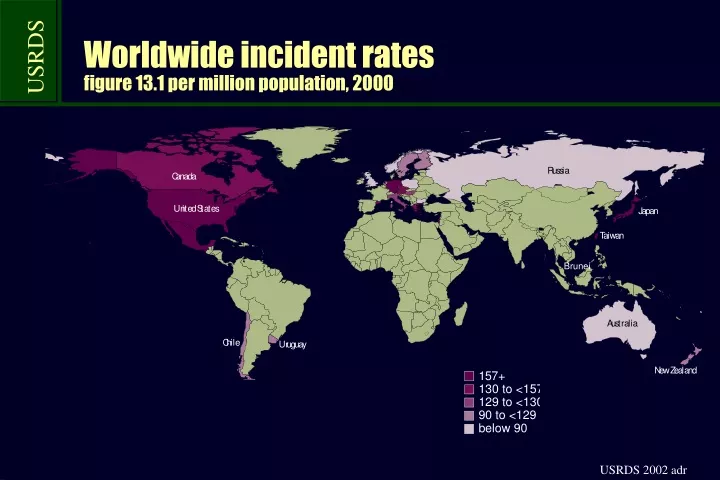
Worldwide incident ratesfigure 13.1 per million population, 2000
Worldwide incident ratesfigure 13.1 per million population, 2000
Prevalence of ESRDtable 13.a per million population, 2000 (cont.)
Prevalence of ESRD: reporting countriesfigure 13.2, per million population, 2000
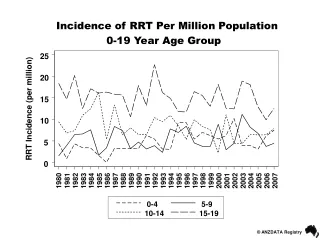
Prevalence of ESRD by age: 0–19figure 13.3 per million population, 2000
Prevalence of ESRD by age: 20–44figure 13.3 per million population, 2000
Prevalence of ESRD by age: 45–64figure 13.3 per million population, 2000
Prevalence of ESRD by age: 65–74figure 13.3 per million population, 2000
Prevalence of ESRD by age: 75+figure 13.3 per million population, 2000
Percent of incident patients with diabetesTable 13.b per million population, 2000
Incidence of ESRDTable 13.c per million population, 2000 (cont.)
Percent of incident patients with diabetesfigure 13.4 per million population, 2000
Incidence of ESRD by age: 0–19figure 13.6 per million population, 2000
Incidence of ESRD by age: 20–44figure 13.6 per million population, 2000
Incidence of ESRD by age: 45–64figure 13.6 per million population, 2000
Incidence of ESRD by age: 65–74figure 13.6 per million population, 2000
Incidence of ESRD by age: 75+figure 13.6 per million population, 2000
Percent distribution of dialysis patients table 13.d (cont.)
Distribution of prevalent dialysis patientsfigure 13.7, 2000
Prevalent rates of functioning graftstable 13.e per million population, 2000
Prevalent rates of functioning graftsfigure 13.9 per million population, 2000
Transplantation ratestable 13.f per million population, 2000
Transplantation ratesfigure 13.10 per million population, 2000
Transplantation rates by age: 0–19figure 13.11 per million population, 2000
Transplantation rates by age: 20–44figure 13.11 per million population, 2000
Transplantation rates by age: 45–64figure 13.11 per million population, 2000
Transplantation rates by age: 65–74figure 13.11 per million population, 2000
Transplantation rates by age: 75+figure 13.11 per million population, 2000