Download
1 / 28
280 likes | 442 Views
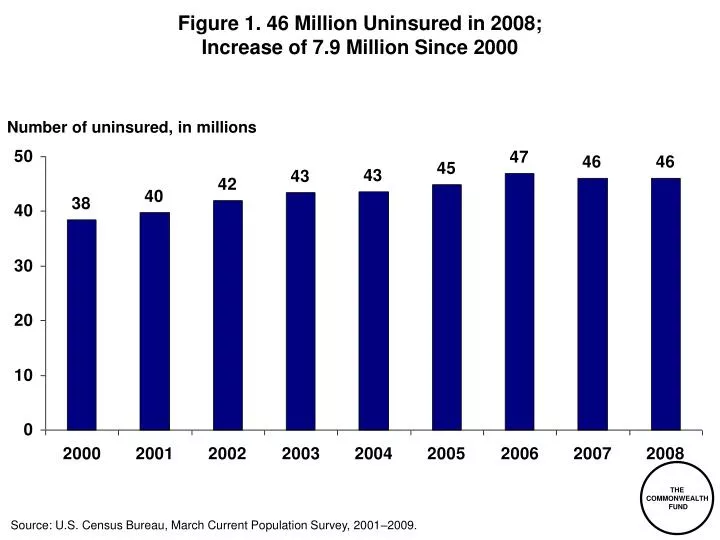
Figure 1. 46 Million Uninsured in 2008; Increase of 7.9 Million Since 2000 . Number of uninsured, in millions. Source: U.S. Census Bureau, March Current Population Survey, 2001–2009. Figure 2. 25 Million Adults Underinsured in 2007, Up from 16 Million in 2003. Uninsured during the year 45.5

E N D
Figure 1. 46 Million Uninsured in 2008;Increase of 7.9 Million Since 2000 Number of uninsured, in millions Source: U.S. Census Bureau, March Current Population Survey, 2001–2009.
Figure 2.25 Million Adults Underinsured in 2007,Up from 16 Million in 2003 Uninsured during the year 45.5 (26%) Uninsured during the year 49.5 (28%) Insured all year, not underinsured 110.9 (65%) Insured all year, not underinsured 102.3 (58%) Insuredall year, underinsured 25.2 (14%) Insuredall year, underinsured 15.6 (9%) 2003 Adults ages 19–64 (172.0 million) 2007 Adults ages 19–64 (177.0 million) *Underinsured defined as insured all year but experienced one of the following: medical expenses equaled 10% or more of income; medical expenses equaled 5% or more of income if low-income (<200% of poverty); or deductibles equaled 5% or more of income. Source: C. Schoen, S. R. Collins, J. L. Kriss, and M. M. Doty, “How Many Are Underinsured? Trends Among U.S. Adults, 2003 and 2007,” Health Affairs Web Exclusive, June 10, 2008. Data: Commonwealth Fund Biennial Health Insurance Surveys (2003 and 2007).
Figure 3. Half of Adults with Low Incomes Lack CoverageDuring the Year; Another Quarter Are Underinsured Percent of adults ages 19–64 72 68 42 35 27 17 Total Under 200%of poverty At or above 200% of poverty *Underinsured defined as insured all year but experienced one of the following: medical expenses equaled 10% or more of income; medical expenses equaled 5% or more of income if low-income (<200% of poverty); or deductibles equaled 5% or more of income. Source: C. Schoen, S. R. Collins, J. L. Kriss, and M. M. Doty, “How Many Are Underinsured? Trends Among U.S. Adults, 2003 and 2007,” Health Affairs Web Exclusive, June 10, 2008. Data: Commonwealth Fund Biennial Health Insurance Surveys (2003 and 2007).
Figure 4. Underinsured Adults are More Likely to Have Health Plans With Coverage Limits; Less Likely to Have Dental Coverage Percent of insured adults (ages 19–64) Source: C. Schoen, S. Collins, J. Kriss, M. Doty, How Many are Underinsured? Trends Among U.S. Adults, 2003 and 2007, Health Affairs Web Exclusive, June 10, 2008. Data: 2007 Commonwealth Fund Biennial Health Insurance Survey
Figure 5. Underinsured Adults Report Higher Rates of Health Insurance Plan Problems than Adults with Adequate Insurance Percent of adults ages 19–64 who were insured all yearand had problems with health insurance plan Source: S. R. Collins, J. L. Kriss, M. M. Doty, and S. D. Rustgi, Losing Ground: How the Loss of Adequate Health Insurance Is Burdening Working Families: Findings from the Commonwealth Fund Biennial Health Insurance Surveys, 2001–2007, The Commonwealth Fund, August 2008.
Figure 6. Adults with Plans Purchased on the Individual Insurance Market Are More Likely to Underinsured Than Those with Employer Coverage Percent of privately insured adults ages 19–64 who are underinsured Notes: Underinsured defined as insured all year but experienced one of the following: medical expenses equaled 10% or more of income; medical expenses equaled 5% or more of income if low-income (<200% of poverty); or deductibles equaled 5% or more of income. Adults continuously insured all year with employer-sponsored insurance or individual insurance. Source: M. M. Doty, S. R. Collins, J. L. Nicholson, and S. D. Rustgi, Failure to Protect: Why the Individual Insurance Market Is Not a Viable Option for Most U.S. Families, The Commonwealth Fund, July 2009.
Figure 7. Increases in Health Insurance PremiumsCompared with Other Indicators, 1988–2009 Percent * * * Estimate is statistically different from the previous year shown at p<0.05. ^ Estimate is statistically different from the previous year shown at p<0.1. Note: Data on premium increases reflect the cost of health insurance premiums for a family of four. Historical estimates of workers’ earnings have been updated to reflect new industry classifications (NAICS). Source: Premiums: Henry J. Kaiser Family Foundation/Health Research and Educational Trust Survey of Employer-Sponsored Health Benefits, 1999–2007, and KPMG Survey of Employer-Sponsored Health Benefits, 1993 and 1996. Inflation: Bureau of Labor Statistics, Consumer Price Index (U.S. City Average of Annual Inflation, April to April), 1993–2009. Earnings: Bureau of Labor Statistics, seasonally adjusted data from the Current Employment Statistics Survey (April to April), 1993–2009. NHE: A. Cisko, C. Truffer, S. Smith, et al, “Health Spending Projections Through 2018: Recession Effects Add Uncertainty To The Outlook,” Health Affairs, 28, no. 2 (2009): w346-w357.
Figure 8. Projected Premiums for Family Coverage, 2008, 2015, 2020 Health insurance premiums for family coverage 1 1The lowest state is Idaho; highest state is Massachusetts. Data: 2008 premium data from Agency for Healthcare Research and Quality, Center for Financing, Access and Cost Trends, 2008 Medical Expenditure Panel Survey-Insurance Component; Premium estimates for 2015 and 2020 based on CMS, Office of the Actuary, National Health Statistics Group, national health expenditures per capita annual growth rate. Source: C. Schoen, J.L. Nicholson, S.D. Rustgi, Paying the Price: How Health Insurance Premiums Are Eating Up Middle-Class Incomes, State-by-State Health Insurance Premium Projections With and Without National Reform (New York: The Commonwealth Fund) August 2009.
Figure 9. Deductibles Rise Sharply, Especially in Small Firms, 2000–2009 Mean deductible for single coverage (PPO, in-network) PPO = preferred provider organization. PPOs covered 57 percent of workers enrolled in an employer-sponsored health insurance plan in 2007. Source: The Kaiser Family Foundation/Health Research and Educational Trust, Employer Health Benefits, 2000 and 2009 Annual Surveys.
Figure 10. Adults with Higher Deductibles Are More Likely to Spend $1,000 or More on Family Out-of-Pocket Expenses, 2007 Percent of privately insured adults ages 19–64 69 63 48 43 Annual Deductible Notes: Family out-of-pocket expenses include out-of-pocket spending on medical care, prescription drugs, and dental and vision care. Does not include premium costs. Numbers may not sum because of rounding. Adults continuously insured all year with employer-sponsored insurance or individual insurance. Source: M. M. Doty, S. R. Collins, J. L. Nicholson, and S. D. Rustgi, Failure to Protect: Why the Individual Insurance Market Is Not a Viable Option for Most U.S. Families, The Commonwealth Fund, July 2009.
Figure 11. Increasing Shares of Adults Across the Income ScaleAre Spending Large Amounts of Incomeon Out-of-Pocket Costs and Premiums, 2001–2007 Percent of privately insured adults ages 19–64 with high out-of-pocket costs and premiums Out-of-Pocket Costs Equal 5% or More of Household Income Out-of-PocketCosts Equal 10% or More of Household Income Notes: Family out-of-pocket costs include all medical expenses, premiums, and prescription drug spending. Adults continuously insured all year with employer-sponsored insurance or individual insurance. FPL = Federal Poverty Level. Source: M. M. Doty, S. R. Collins, J. L. Nicholson, and S. D. Rustgi, Failure to Protect: Why the Individual Insurance Market Is Not a Viable Option for Most U.S. Families, The Commonwealth Fund, July 2009.
Figure 12. The Individual Insurance MarketIs Not an Affordable Option for Many People * FPL = federal poverty level. Source: M. M. Doty, S. R. Collins, J. L. Nicholson, and S. D. Rustgi, Failure to Protect: Why the Individual Insurance Market Is Not a Viable Option for Most U.S. Families, The Commonwealth Fund, July 2009.
Figure 13. Deductibles, Premium Costs, and Out-of-Pocket SpendingAre Higher for Adults with Individual Insurance, 2007 Percent of privately insured adults ages 19–64 * Out-of-pocket costs include all medical expenses, premiums, and prescription drug spending. Note: Adults continuously insured all year with employer-sponsored insurance or individual insurance. Source: M. M. Doty, S. R. Collins, J. L. Nicholson, and S. D. Rustgi, Failure to Protect: Why the Individual Insurance Market Is Not a Viable Option for Most U.S. Families, The Commonwealth Fund, July 2009.
Figure 14. More than Three of Five Adults with Individual Market Coverage Have Annual Premium Costs of $3,000 or More, 2007 Percent of privately insured adults ages 19–64 64 23 20 Note: Adults continuously insured all year with employer-sponsored insurance or individual insurance. Source: Commonwealth Fund Biennial Health Insurance Survey (2007).
Figure 15. Individual Insurance Plans Are More Likely to Limit Benefits and Require Greater Cost-Sharing in 2007 Percent of privately insured adults ages 19–64 Note: Adults continuously insured all year with employer-sponsored insurance or individual insurance. Source: M. M. Doty, S. R. Collins, J. L. Nicholson, and S. D. Rustgi, Failure to Protect: Why the Individual Insurance Market Is Not a Viable Option for Most U.S. Families, The Commonwealth Fund, July 2009.
Figure 16. More Privately Insured Adults Are Spending Large Amountsof Income on Out-of-Pocket Costs and Premiums, 2001–2007 Percent of privately insured adults ages 19–64 with high out-of-pocket costs and premiums Out-of-Pocket Costs Equal5% or More of Household Income Out-of-PocketCosts Equal10% or More of Household Income Notes: Family out-of-pocket costs include all medical expenses, premiums, and prescription drug spending. Adults continuously insured all year with employer-sponsored insurance or individual insurance. Source: M. M. Doty, S. R. Collins, J. L. Nicholson, and S. D. Rustgi, Failure to Protect: Why the Individual Insurance Market Is Not a Viable Option for Most U.S. Families, The Commonwealth Fund, July 2009.
Figure 17. Uninsured and Underinsured AdultsReport High Rates of Cost-Related Access Problems Percent of adults ages 19–64 who had cost-related access problemsin the past 12 months Source: S. R. Collins, J. L. Kriss, M. M. Doty, and S. D. Rustgi, Losing Ground: How the Loss of Adequate Health Insurance Is Burdening Working Families: Findings from the Commonwealth Fund Biennial Health Insurance Surveys, 2001–2007, The Commonwealth Fund, August 2008.
Figure 18. Uninsured and Underinsured Adults with Chronic Conditions Are More Likely to Visit the ER for Their Conditions Percent of adults ages 19–64 withat least one chronic condition* *Hypertension, high blood pressure; heart disease; diabetes; asthma, emphysema, or lung disease. **Adults with at least one chronic condition who take prescription medications on a regular basis. Source: S. R. Collins, J. L. Kriss, M. M. Doty, and S. D. Rustgi, Losing Ground: How the Loss of Adequate Health Insurance Is Burdening Working Families: Findings from the Commonwealth Fund Biennial Health Insurance Surveys, 2001–2007, The Commonwealth Fund, August 2008.
Figure 19. Sixty Percent of Underinsured or Uninsured Adults Reported Medical Bill Problems or Debt Percent of adults ages 19–64 with medical bill problemsor accrued medical debt *Includes only those individuals who had a bill sent to a collection agency when they were unable to pay it. Source: S. R. Collins, J. L. Kriss, M. M. Doty, and S. D. Rustgi, Losing Ground: How the Loss of Adequate Health Insurance Is Burdening Working Families: Findings from the Commonwealth Fund Biennial Health Insurance Surveys, 2001–2007, The Commonwealth Fund, August 2008.
Figure 20. More Than One-Quarter of Adults Under Age 65 with Medical Bill Burdens and Debt Were Unable to Pay for Basic Necessities Percent of adults ages 19–64 with medical bill problemsor accrued medical debt Source: S. R. Collins, J. L. Kriss, M. M. Doty, and S. D. Rustgi, Losing Ground: How the Loss of Adequate Health Insurance Is Burdening Working Families: Findings from the Commonwealth Fund Biennial Health Insurance Surveys, 2001–2007, The Commonwealth Fund, August 2008.
Figure 21. America’s Health Choices Act (H.R. 3200) As Amended Source: Commonwealth Fund analysis of H.R. 3200.
Figure 22. Trend in the Number of Uninsured, 2012–2020Under Current Law and H.R. 3200 Millions Note: The uninsured includes unauthorized immigrants. With unauthorized immigrants excluded from the calculation, 97% of legal nonelderly residents are projected to have insurance under H.R. 3200. Data: Estimates by The Congressional Budget Office.
Figure 23. America’s Health Choices Act (H.R. 3200) As Amended Source: Commonwealth Fund analysis of health reform proposals.
Figure 24. Annual Premium Amount Paid by Individuals Under House Energy and Commerce Committee Health Reform Proposal Annual premium amount Lower Cost Area Higher Cost Area Medium Cost Area FPL = Federal Poverty Level Note: Estimates are for single adults with no access to employer coverage. Source: Health Reform Subsidy Calculator – Premium Assistance for Coverage in Exchanges/Gateways, Kaiser Family Foundation, http://healthreform.kff.org/Subsidycalculator.aspx, accessed 10/9/09.
NH ME WA VT ND MT MN OR MA NY WI SD ID RI MI WY CT PA NJ IA OH NE DE NV IN IL MD WV UT VA DC CO CA MO KS KY NC TN OK SC AR AZ NM GA MS AL LA TX FL 80%–100% 70%–79% 50%–69% Less than 50% Figure 25. Concentrated Insurance Markets: Market Share of Two Largest Health Plans, by State, 2006 AK HI Note: Market shares include combined HMO+PPO products. For MS and PA share = top 3 insurers 2002-2003. Source: American Medical Association, Competition in health insurance: A comprehensive study of U.S. markets, 2008 update; MS and PA from J. Robinson, “Consolidation and the Transformation of Competition in Health Insurance,” Health Affairs, Nov/Dec 2004; ND from D. McCarthy et al., “The North Dakota Experience: Achieving High-Performance Health Care Through Rural Innovation and Cooperation,” The Commonwealth Fund, May 2008.
Figure 26. Effect of HR 3200 on Insurance Coverage of People Under Age 65, 2015(in millions) Current Law House Tri-Committee Uninsured 16 m 6% Uninsured 51 m 19% Employer 162 m 59% Employer 166 m 61% Medicaid 45 m 16% Other 15 m 5% Medicaid 34 m 12% Non-group 8 m 3% Other 15 m 5% Exchange- Public 9 m 3% Non-group 14 m 5% Exchange- Private 18 m 6% Source: Congressional Budget Office, Letters to Honorable Charles Rangel and Honorable Henry Waxman, July 17, 2009.
Figure 27. System Improvement Provisions of National HealthReform Proposals, 2009 Source: Commonwealth Fund analysis of health reform proposals.
Figure 28. Major Sources of Savings And Revenues Compared with Projected Spending, Net Cumulative Effect on Federal Deficit, 2010–2019 Dollars in billions Source: The Congressional Budget Office Analysis of HR 3200, The Affordable Health Choices Act, July 17, 2009, http://www.cbo.gov/ftpdocs/104xx/doc10464/hr3200.pdf.