Download
1 / 46
460 likes | 467 Views
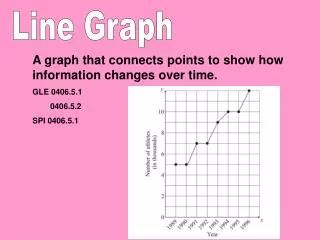
Figure 13.1 An ordinary line graph. Figure 13.2 a) A campus map as a graph; b) a subgraph. Figure 13.3 Graphs that are a) connected; b) disconnected; and c) complete. Figure 13.4 a) A multigraph is not a graph; b) a self edge is not allowed in a graph. Figure 13.5a a) A weighted graph.

E N D
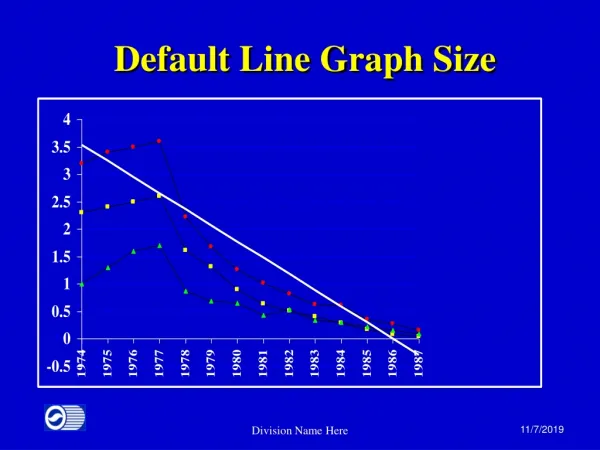
Figure 13.1 An ordinary line graph
Figure 13.2 a) A campus map as a graph; b) a subgraph
Figure 13.3 Graphs that are a) connected; b) disconnected; and c) complete
Figure 13.4 a) A multigraph is not a graph; b) a self edge is not allowed in a graph
Figure 13.5a a) A weighted graph
Figure 13.5b b) A directed graph
Figure 13.6 a) A directed graph and b) its adjacency matrix
Figure 13.7 a) A weighted undirected graph and b) its adjacency matrix
Figure 13.8 a) A directed graph and b) its adjacency list
Figure 13.9 a) A weighted undirected graph and b) its adjacency list
Figure 13.10 Visitation order for a) a depth-first search; b) a breadth-first search
Figure 13.11 A connected graph with cycles
Figure 13.12 The results of a depth-first traversal, beginning at vertex a, of the graph in Figure 13-11
Figure 13.13 The results of a breadth-first traversal, beginning at vertex a, of the graph in Figure 13-11
Figure 13.14 A directed graph without cycles
Figure 13.15 The graph in Figure 13-14 arranged according to the topological orders a) a, g, d, b, e, c, f and b) a, b, g, d, e, f, c
Figure 13.16a A trace of topSort1 for the graph in Figure 13-14
Figure 13.16b A trace of topSort1 for the graph in Figure 13-14
Figure 13.17 A trace of topSort2 for the graph in Figure 13-14
Figure 13.18 A spanning tree for the graph in Figure 13-11
Figure 13.19 Connected graphs that each have four vertices and three edges
Figure 13.20 The DFS spanning tree rooted at vertex a for the graph in Figure 13-11
Figure 13.21 The BFS spanning tree rooted at vertex a for the graph in Figure 13-11
Figure 13.22 A weighted, connected, undirected graph
Figure 13.23a and 13.23b A trace of PrimsAlgorithm for the graph in Figure 13-22, beginning a vertex a
Figure 13.23c and 13.23d A trace of PrimsAlgorithm for the graph in Figure 13-22, beginning a vertex a
Figure 13.23e and 13.23f A trace of PrimsAlgorithm for the graph in Figure 13-22, beginning a vertex a
Figure 13.23g and 13.23h A trace of PrimsAlgorithm for the graph in Figure 13-22, beginning a vertex a
Figure 13.23i A trace of PrimsAlgorithm for the graph in Figure 13-22, beginning a vertex a
Figure 13.24 a) A weighted directed graph and b) its adjacency matrix
Figure 13.25 A trace of the shortest-path algorithm applied to the graph in Figure 13-24a
Figure 13.26a and b Checking weight[u] by examining the graph: a) weight[2] in Step 2;b) weight[1] in Step 3
Figure 13.26c and d Checking weight[u] by examining the graph: c) weight[3] in Step 3;b) weight[3] in Step 4
Figure 13.27 a) Euler’s bridge problem and b) its multigraph representation
Figure 13.28 Pencil and paper drawings
Figure 13.29 Connected undirected graphs based on the drawings in Figure 13-28
Figure 13.30 The steps to determine an Euler circuit for the graph in Figure 13-29b
Figure 13.31 The three utilities problem
Figure 13.32 Graphs for Self-Test Exercises 1, 2, and 3
Figure 13.33 A graph for Self-Test Exercises 6 and 7 and Exercises 1 and 3
Figure 13.34 A graph for Exercise 1
Figure 13.35 A graph for Exercises 3 and 8
Figure 13.36 Graphs for Exercises 5 and 6
Figure 13.37 A graph for Exercise 11
Figure 13.38 A graph for Exercise 13