Download
1 / 59
590 likes | 590 Views
This study analyzes the effect of terrain on monsoon convection in the Himalayan region by evaluating precipitation distribution and its relation to topography and surrounding oceans. The study also explores the role of orography and synoptics in intense convection observed over the foothills.

E N D
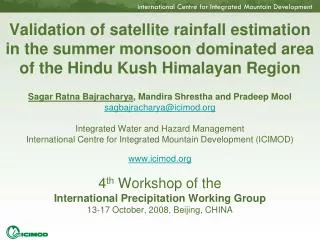
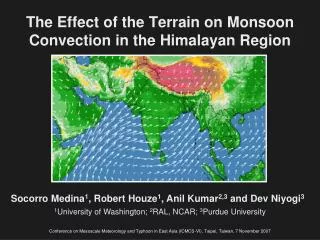
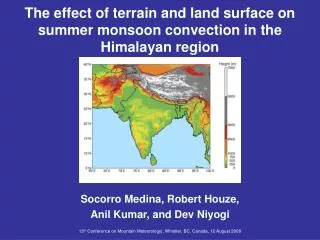
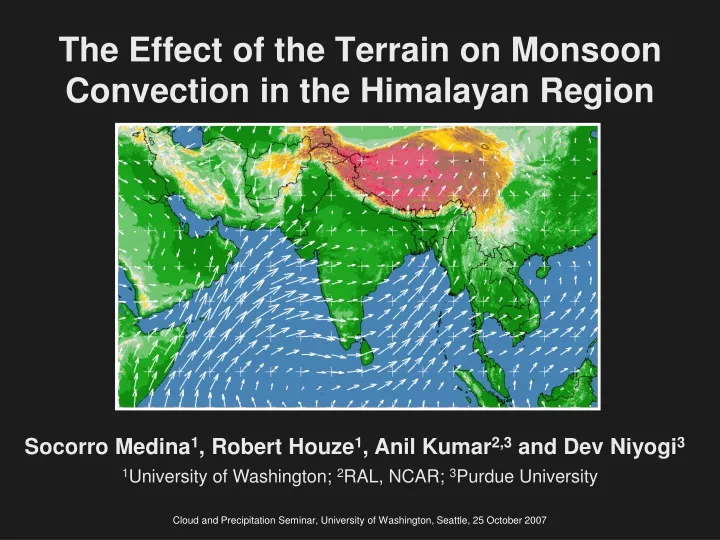
The Effect of the Terrain on Monsoon Convection in the Himalayan Region Socorro Medina1, Robert Houze1, Anil Kumar2,3 and Dev Niyogi3 1University of Washington; 2RAL, NCAR; 3Purdue University Cloud and Precipitation Seminar, University of Washington, Seattle, 25 October 2007
Precipitation distribution in relation to terrain Afghanistan Pakistan Arabian Sea Bay of Bengal Orography (km) Jun-Aug precipitation (mm/month) (Climatology from TRMM-PR data from 1997-2004) Xie et al. (2006)
MOTIVATION – MONSOON 2007 (Jun-Aug) Precipitation (mm) Anomaly (%)
MONSOON CONVECTION IN THE HIMALAYAN REGION – Three part study 1 Houze, Wilton, and Smull (2007) – 3D structure of intense storms and their distribution in relation to topography and surrounding oceans • Ulrike Romatschke (Ulli) – Is extending Houze et al. (2007) study Cloud and Precipitation Seminar Nov 15th • Analyze numerical simulations to investigate the detailed role of the terrain – preliminary results
MONSOON CONVECTION IN THE HIMALAYAN REGION – Three part study 1 Houze, Wilton, and Smull (2007) – 3D structure of intense storms and their distribution in relation to topography and surrounding oceans • Ulrike Romatschke (Ulli) – Is extending Houze et al. (2007) study Cloud and Precipitation Seminar Nov 15th • Analyze numerical simulations to investigate the detailed role of the terrain – preliminary results
Houze, Wilton, and Smull (2007) study • Data from Precipitation Radar (PR) on the Tropical Rainfall Measuring Mission (TRMM) satellite (June-September 2002/2003) • Found contiguous radar echoes that exceeded some size threshold • Analyzed separately convective and stratiform radar echoes
Convective and stratiform radar reflectivity echoes Horizontal cross-section Vertical cross-section convective echo Vertical cross-section stratiform echo Houze (1997)
Western Central Eastern Results of Houze et al. (2007): Deep Intense Convective Cores 40 dBZ echo > 10 km in height Wide Intense Convective Cores 40 dBZ echo > 1000 km2 area Broad Stratiform Echo > 50,000 km2
Example of Deep Intense Convective Core (40 dbz echo >10 km in height) 10 m winds reanalysis at 1200 UTC 14 Jun 2002 Example: Reflectivity at 0900 UTC 14 Jun 2002 Delhi sounding 00 UTC 14 Jun 2002 Orography Houze et al. (2007)
dry,hot moist Carlson et al. 1983
Western Central Eastern Results of Houze et al. (2007): Deep Intense Convective Cores 40 dBZ echo > 10 km in height Wide Intense Convective Cores 40 dBZ echo > 1000 km2 area Broad Stratiform Echo stratiform echo > 50,000 km2
Example of Wide Intense Convective Core (40 dbz echo >1000 km2 in area) Example: Reflectivity at 2208 UTC 3 Sep 2003 Houze et al. (2007)
Western Central Eastern Results of Houze et al. (2007): Deep Intense Convective Cores 40 dBZ echo > 10 km in height Wide Intense Convective Cores 40 dBZ echo > 1000 km2 area Broad Stratiform Echo stratiform echo > 50,000 km2
Example of Broad Stratiform Echo (>50,000 km2 in area) 00 UTC 11 Aug 2002 Tengchong sounding Example: Infrared satellite temperature and reflectivity at ~03 UTC 11 Aug 2002 10 m winds reanalysis at 00 UTC 11 Aug 2002 Houze et al. (2007)
MONSOON CONVECTION IN THE HIMALAYAN REGION – Three part study 1 Houze, Wilton, and Smull (2007) – 3D structure of intense storms and their distribution in relation to topography and surrounding oceans • Ulrike Romatschke (Ulli) – Is extending Houze et al. (2007) study Cloud and Precipitation Seminar Nov 15th • Analyze numerical simulations to investigate the detailed role of the terrain – preliminary results
MONSOON CONVECTION IN THE HIMALAYAN REGION – Three part study 1 Houze, Wilton, and Smull (2007) – 3D structure of intense storms and their distribution in relation to topography and surrounding oceans • Ulrike Romatschke (Ulli) – Is extending Houze et al. (2007) study Cloud and Precipitation Seminar Nov 15th • Analyze numerical simulations to investigate the detailed role of the terrain – preliminary results
OBJECTIVES • Evaluate if high-resolution models can predict the structures observed by Houze et al. (2007) • Test the ideas put forward in that study: • Investigate why the intense convection is often observed over the foothills • Analyze the relative roles of orography and synoptics in systems observed in association with Bay of Bengal depressions
NUMERICAL SIMULATIONS • Weather Research and Forecasting (WRF v2.1.1) model (runs conducted by Anil Kumar, NCAR/Purdue University) • NCEP Reanalysis used as initial and boundary conditions (6 hourly) • Bulk microphysical parameterization: WRF Single-Moment with 6 water substances • Isolated deep convective system: dx1=9 km; dx2 = 3 km (14 Jun 2002) Simulation couldn’t capture system • Wide intense convective system (3 Sep 2003) • Broad stratiform system (11 Aug 2002) • HYSPLIT model trajectories using NCEP reanalysis (http://www.arl.noaa.gov/ready/hysplit4.html)
Wide convective system simulationTime: 18-23 UTC 3 Sep 2003 (0030-0530 LST) Terrain and accumulated precipitation (mm) Pakistan India Domain 1: dx = 9 km Domain 2: dx = 3 km
Pakistan India Pakistan India Wide convective system Evaluation at 2130 UTC 03 Sep 2003 (0400 LST, t=3.5 h) ObservationsInfrared satellite temperature (shaded, K)and low-resolution terrain (black contours, km) WRF-simulationCloud top temperature (shaded, K)and terrain (black contours, m)
Pakistan India Pakistan India Wide convective system Evaluation at 2130 UTC 03 Sep 2003 (0400 LST, t=3.5 h) ObservationsInfrared satellite temperature (shaded, K)and low-resolution terrain (black contours, km) WRF-simulationCloud top temperature (shaded, K)and terrain (black contours, m)
Pakistan India Pakistan India Wide convective system Evaluation at 2230 UTC 03 Sep 2003 (0500 LST, t=4.5 h) ObservationsInfrared satellite temperature (shaded, K)and low-resolution terrain (black contours, km) WRF-simulationCloud top temperature (shaded, K)and terrain (black contours, m)
Pakistan India Pakistan India Wide convective system Evaluation at 2300 UTC 03 Sep 2003 (0530 LST, t=5.0 h) ObservationsInfrared satellite temperature (shaded, K)and low-resolution terrain (black contours, km) WRF-simulationCloud top temperature (shaded, K)and terrain (black contours, m)
Wide convective system – Evaluation of reflectivity (22 UTC 3 Sep) Observations WRF-simulation
Wide convective system – Hypotheses testing 0.5 km 2.5 km HYPOTHESIS - Low-level moist southwesterly flow was capped by dry air flowing off the high Tibetan Plateau or the Afghan mountains Surface water vapor mixing ratio (g/kg) and winds Backward trajectories (HYSPLIT/NCEP) http://www.arl.noaa.gov/ready/hysplit4.html
Wide convective system – Hypotheses testing HYPOTHESIS - Low-level moist southwesterly flow was capped by dry air flowing off the Afghan mountains Surface dew point depression (°C)
Wide convective system – Hypotheses testing HYPOTHESIS - Low-level moist southwesterly flow was capped by dry air flowing off the Afghan mountains Soundings at 1800 UTC Dry side Moist side
3000 2000 1000 Wide convective system – Hypotheses testing HYPOTHESIS - Convection started where the potentially unstable column was subjected to orographic lifting CAPE (J/kg)
Wide convective system – Hypotheses testing HYPOTHESIS - Convection started where the potentially unstable column was subjected to orographic lifting Surface dew point depression (°C) and vertically integrated mixing ratio of precipitating hydrometeors (mm) at 1925 UTC (t=1.25 h)
20 18 16 12 8 4 Wide convective system – Hypotheses testing HYPOTHESIS - Convection started where the potentially unstable column was subjected to orographic lifting Mixing ratio (g/kg) of water vapor (shaded), cloud hydrometeors (dark red) and precipitating hydrometeors (dark blue) at 1815 UTC
20 18 16 12 8 4 Wide convective system – Hypotheses testing HYPOTHESIS - Convection started where the potentially unstable column was subjected to orographic lifting Mixing ratio (g/kg) of water vapor (shaded), cloud hydrometeors (dark red) and precipitating hydrometeors (dark blue) at 1830 UTC
20 18 16 12 8 4 Wide convective system – Hypotheses testing HYPOTHESIS - Convection started where the potentially unstable column was subjected to orographic lifting Mixing ratio (g/kg) of water vapor (shaded), cloud hydrometeors (dark red) and precipitating hydrometeors (dark blue) at 1845 UTC
20 18 16 12 8 4 Wide convective system – Hypotheses testing HYPOTHESIS - Convection started where the potentially unstable column was subjected to orographic lifting Mixing ratio (g/kg) of water vapor (shaded), cloud hydrometeors (dark red) and precipitating hydrometeors (dark blue) at 1900 UTC
Dew point depression > 10°C CAPE > 1800 J/kg CIN > 150 J/kg Temperature > 31°C Mixing ratio > 20 g/kg Wide convective system – Role of the NW concave indentation of the terrain ‘Idealized’ (highly smoothed) low-level variables Relative Humidity (% ) - Shaded
CONCLUSIONS Convective systems • High-resolution model was able to predict the observed structures (if the system is wide enough AND the model has enough resolution) • In Wide Intense Convective storm, the terrain appears to play three main roles: • The NW concave indentation of the terrain increases the existing humidity gradients • Elevated layer of dry, warm air originates over the Afghan mountains and caps the moist low-level flow allows buoyancy to build up • The convection is triggered at the small features of terrain (h<0.5 km): orographic lifting, convergence or both
Broad stratiform system simulationTime: 12 UTC 10 Aug – 03 UTC 11 Aug 2003 (1830-0930 LST)Terrain and accumulated precipitation (mm) Domain 1: dx = 27 km Domain 2: dx = 9 km
Broad stratiform system –Evaluation of low-levels winds at 00 UTC 11 Aug 2002 Observations10 m winds and wind speed (m/s) WRF-simulationSurface winds and wind speed (m/s)and terrain (red contours)
Broad stratiform system – Evaluation of IR temperature and reflectivity Observations WRF-simulation
Broad stratiform system –Sounding at Tengchong at 00 UTC 11 Aug 2002 Observations WRF-simulation
Rainrate > 5 mm/hr Mixing ratio > 21 g/kg SLP Wind speed > 5m/s Broad stratiform system – Role of the Bay of Bengal Depression ‘Idealized’ (highly smoothed) low-level variables LOW
PRELIMINARY CONCLUSIONS – Broad stratiform system • The high-resolution model was able to predict the observed structures • The Bay of Bengal depression provides low-level moisture and cross-barrier flow • Low-level flow channeled between individual ranges and impinges into the NE indentation of the Himalayas
Concluding remark…. Schultz et al. 2000 “In diagnosing precipitation processes, assessing the mechanism for forcing ascent should be the primary concern. The degree of instability… merely modulates the response to the forcing”
Dew point depression > 10°C CAPE > 1800 J/kg CIN > 150 J/kg Temperature > 31°C Mixing ratio > 20 g/kg Equivalent potential temperature > 364 K Wide convective system – Role of the NW concave indentation of the terrain ‘Idealized’ (highly smoothed) low-level variables
Wide convective system – Hypotheses testing HYPOTHESIS - Convection started where the potentially unstable column was subjected to orographic lifting CAPE (for parcel with max theta_e, J/kg) CIN (for parcel with max theta_e, J/kg)