Download
1 / 90
900 likes | 905 Views
School Health Profiles 2012 State Results. National Center for HIV/AIDS, Viral Hepatitis, STD, and TB Prevention. Division of Adolescent and School Health. What is the School Health Profiles (Profiles)?.

E N D
School Health Profiles2012State Results National Center for HIV/AIDS, Viral Hepatitis, STD, and TB Prevention Division of Adolescent and School Health
What is the School Health Profiles (Profiles)? • Profiles is a system of surveys assessing school health policies and practices in states, territories, large urban school districts, and tribal governments • Profiles surveys are conducted biennially (during even-numbered years) by state, territorial, local, and tribal government education and health agencies with technical assistance from CDC • Profiles questionnaires are administered to middle and high school principals and lead health education teachers
Topics Monitored by Profiles • School health education requirements and content • Physical education and physical activity • School health policies related to HIV infection/AIDS, tobacco-use prevention, and nutrition • Asthma management activities • Family and community involvement in school health programs • School health coordination
Uses of Profiles Data Education and health officials use Profiles data to • Describe school health policies and practices and compare them across jurisdictions • Identify professional development needs • Plan and monitor programs • Support health-related policies and legislation • Seek funding • Garner support for future surveys
Examples of Uses of Profiles Data • Utah • Used Profiles data on an informational handout that included school health policy recommendations on cancer, diabetes, and injury prevention • Shared handout with stakeholders at a Parent Teacher Association Conference to garner support for coordinated school health • Indiana • Used Profiles data in a state-specific Profiles report that included commentaries from Indiana teachers and suggestions for how to improve student health in the state
Profiles Information http://www.cdc.gov/schoolhealthprofiles • Background on the School Health Profiles • Questionnaires and item rationales • Comprehensive results • Fact sheets • Publications and journal articles • Participation history • Data file request form
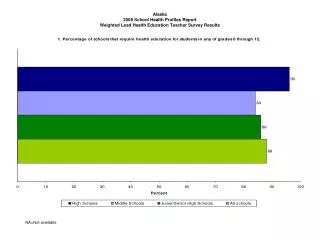
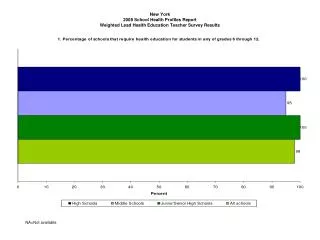
Percentage of secondary schools that require physical education for students in any of grades 6 through 12 64% - 74% 75% - 82% 83% - 88% 89% - 97% No Data School Health Profiles, 2012
Percentage of secondary schools in which at least 1 physical education teacher or specialist received professional development on physical education during the past 2 years 47% - 76% 77% - 85% 86% - 92% 93% - 100% No Data School Health Profiles, 2012
Percentage of secondary schools in which those who teach physical education were provided with key materials for teaching physical education 37% - 62% 63% - 69% 70% - 75% 76% - 93% No Data School Health Profiles, 2012
Percentage of secondary schools that offered opportunities for all students to participate in intramural activities or physical activity clubs 33% - 53% 54% - 62% 63% - 72% 73% - 86% No Data School Health Profiles, 2012
Percentage of secondary schools that taught 12 key physical activity topics in a required course 35% - 51% 52% - 59% 60% - 63% 64% - 78% No Data School Health Profiles, 2012
Percentage of secondary schools that have a joint use agreement for shared use of physical activity facilities 41% - 60% 61% - 64% 65% - 72% 73% - 87% No Data School Health Profiles, 2012
Percentage of secondary schools that offer required physical education, classroom-based physical activity breaks, intramural sports, and interscholastic sports 12% - 18% 19% - 23% 24% - 26% 27% - 46% No Data School Health Profiles, 2012
Percentage of secondary schools that offer required physical education, classroom-based physical activity breaks, intramural sports, and interscholastic sports and have a joint use agreement for shared use of physical activity facilities 6% - 12% 13% - 17% 18% - 20% 21% - 30% No Data School Health Profiles, 2012
Percentage of secondary schools that prohibited all tobacco use at all times in all locations* 33% - 50% 51% - 56% 57% - 60% 61% - 80% No Data *Prohibited the use of all tobacco, including cigarettes, smokeless tobacco, cigars, and pipes, by students, faculty and school staff, and visitors, in school buildings, outside on school grounds, on school buses or other vehicles used to transport students, and at off-campus, school-sponsored events, during school hours and non-school hours. School Health Profiles, 2012
Percentage of secondary schools that implement a tobacco-free environment policy addressing 7 key elements 6% - 10% 11% - 15% 16% - 19% 20% - 33% No Data School Health Profiles, 2012
Percentage of secondary schools that taught 15 key tobacco-use prevention topics in a required course 25% - 42% 43% - 50% 51% - 57% 58% - 80% No Data School Health Profiles, 2012
Percentage of secondary schools that provided tobacco cessation services for students, faculty, and staff at school or through arrangements with providers not on school property 10% - 19% 20% - 25% 26% - 31% 32% - 48% No Data School Health Profiles, 2012
Percentage of secondary schools in which the lead health education teacher received professional development during the 2 years before the survey on tobacco-use prevention 14% - 22% 23% - 25% 26% - 35% 36% - 53% No Data School Health Profiles, 2012
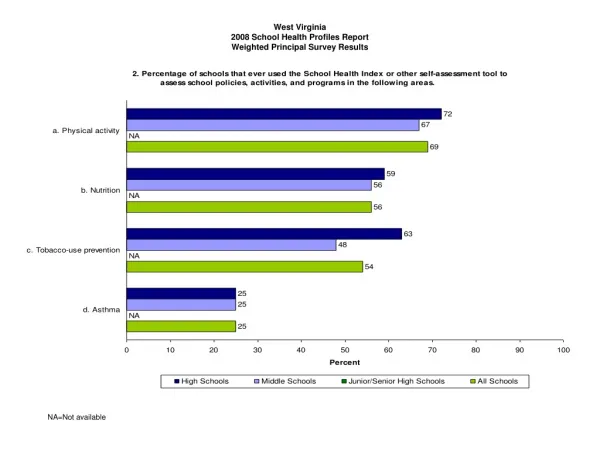
Percentage of secondary schools that used the School Health Index or a similar self-assessment tool to assess their policies, activities, and programs in tobacco-use prevention 24% - 37% 38% - 40% 41% - 46% 47% - 70% No Data School Health Profiles, 2012
Percentage of secondary schools that sometimes, almost always, or always required students who were caught smoking to participate in an assistance, education, or cessation program 13% - 34% 35% - 39% 40% - 49% 50% - 96% No Data School Health Profiles, 2012
Percentage of secondary schools that posted signs marking a tobacco-free school zone 64% - 74% 75% - 82% 83% - 88% 89% - 97% No Data School Health Profiles, 2012
Percentage of secondary schools that provided families with health information to increase parent and family knowledge of tobacco-use prevention 12% - 25% 26% - 28% 29% - 34% 35% - 50% No Data School Health Profiles, 2012
Percentage of secondary schools in which students could not purchase chocolate candy from vending machines or at the school store, canteen, or snack bar 25% - 71% 72% - 79% 80% - 90% 91% - 100% No Data School Health Profiles, 2012
Percentage of secondary schools in which students could not purchase other kinds of candy from vending machines or at the school store, canteen, or snack bar 24% - 66% 67% - 75% 76% - 84% 85% - 96% No Data School Health Profiles, 2012
Percentage of secondary schools in which students could not purchase salty snacks that are not low in fat* from vending machines or at the school store, canteen, or snack bar 31% - 61% 62% - 71% 72% - 78% 79% - 96% No Data *Such as regular potato chips. School Health Profiles, 2012
Percentage of secondary schools in which students could not purchase cookies, crackers, cakes, pastries, or other baked goods that are not low in fat from vending machines or at the school store, canteen, or snack bar 29% - 61% 62% - 70% 71% - 79% 80% - 96% No Data School Health Profiles, 2012
Percentage of secondary schools in which students could not purchase 2% or whole milk from vending machines or at the school store, canteen, or snack bar 57% - 64% 65% - 72% 73% - 77% 78% - 96% No Data School Health Profiles, 2012
Percentage of secondary schools in which students could not purchase soda pop or fruit drinks that are not 100% juice from vending machines or at the school store, canteen, or snack bar 44% - 58% 59% - 69% 70% - 82% 83% - 96% No Data School Health Profiles, 2012
Percentage of secondary schools in which students could not purchase sports drinks* from vending machines or at the school store, canteen, or snack bar 26% - 38% 39% - 53% 54% - 59% 60% - 93% No Data *Such as Gatorade. School Health Profiles, 2012
Percentage of secondary schools that did not sell less nutritious foods and beverages* anywhere outside the school food service program 13% - 29% 30% - 42% 43% - 49% 50% - 88% No Data *Baked goods not low in fat, salty snacks not low in fat, chocolate candy, other kinds of candy, soda pop or fruit drinks that are not 100% juice, and sports drinks School Health Profiles, 2012
Percentage of secondary schools that allowed students to have access to drinking water 64% - 81% 82% - 83% 84% - 88% 89% - 96% No Data School Health Profiles, 2012
Percentage of secondary schools that always offered fruits or non-fried vegetables in vending machines and school stores, canteens, or snack bars and during celebrations when foods and beverages are offered 2% - 6% 7% - 10% 11% - 13% 14% - 23% No Data School Health Profiles, 2012
Percentage of secondary schools that placed fruits and vegetables near the cafeteria cashier, where they are easy to access 38% - 59% 60% - 70% 71% - 75% 76% - 87% No Data School Health Profiles, 2012
Percentage of secondary schools that priced nutritious foods and beverages at a lower cost while increasing the price of less nutritious foods and beverages 3% - 7% 8% - 9% 10% - 12% 13% - 29% No Data School Health Profiles, 2012
Percentage of secondary schools that provided information to students or families on the nutrition and caloric content of foods available 35% - 44% 45% - 46% 47% - 54% 55% - 71% No Data School Health Profiles, 2012
Percentage of secondary schools that used at least 3 different strategies to promote healthy eating 11% - 17% 18% - 22% 23% - 28% 29% - 52% No Data School Health Profiles, 2012
Percentage of secondary schools in which the lead health education teacher received professional development during the 2 years before the survey on nutrition and dietary behavior 21% - 32% 33% - 37% 38% - 41% 42% - 60% No Data School Health Profiles, 2012
Percentage of secondary schools that taught 14 key nutrition and dietary behavior topics in a required course 37% - 61% 62% - 67% 68% - 75% 76% - 87% No Data School Health Profiles, 2012
Percentage of secondary schools that prohibited all forms of advertising and promotion of candy, fast food restaurants, or soft drinks in all locations* 32% - 39% 40% - 45% 46% - 54% 55% - 74% No Data *In school buildings; on school grounds, including on the outside of the school building, on playing fields, or other areas of the campus; on school buses or other vehicles used to transport students; and in school publications. School Health Profiles, 2012
Percentage of secondary schools that used the School Health Index or a similar self-assessment tool to assess their policies, activities, and programs in nutrition and physical activity 24% - 32% 33% - 38% 39% - 43% 44% - 77% No Data School Health Profiles, 2012
Percentage of secondary schools that had a school health council, committee, or team that offers guidance on the development of policies or coordinates activities on health topics 32% - 46% 47% - 56% 57% - 65% 66% - 78% No Data School Health Profiles, 2012
Percentage of secondary schools that have a school health council, committee, or team with representation from 6 or more groups 17% - 28% 29% - 34% 35% - 42% 43% - 65% No Data School Health Profiles, 2012
Percentage of secondary schools that used the School Health Index or other self-assessment tool to assess their policies, activities, and programs in physical activity, nutrition, and tobacco-use prevention 18% - 27% 28% - 32% 33% - 36% 37% - 65% No Data School Health Profiles, 2012