Download
1 / 16
160 likes | 245 Views
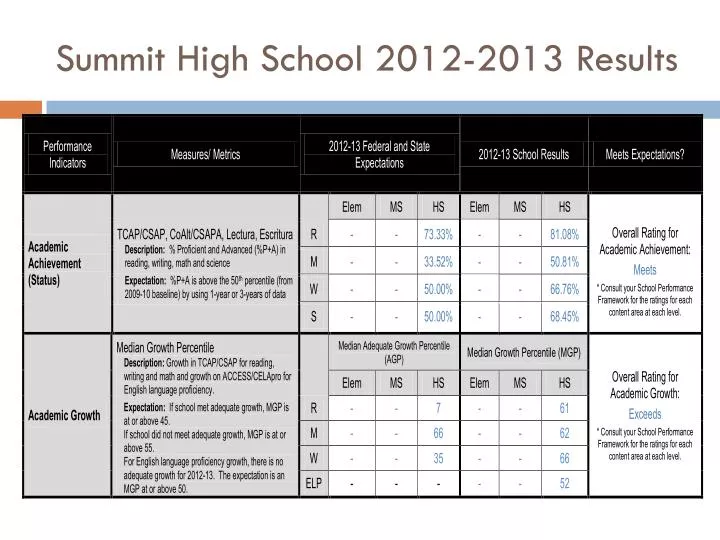
Summit High School 2012-2013 Results. SHS serves a population of 765 students. 30 % (230) of which are non-white, 25% (191) of the students at SHS are Hispanic/Latino, 34 % (260) qualify for Free and Reduced Meal , 22 % (168) are English Language Learners, and

E N D
SHS serves a population of 765 students • 30% (230) of which are non-white, • 25% (191) of the students at SHS are Hispanic/Latino, • 34% (260) qualify for Free and Reduced Meal, • 22% (168) are English Language Learners, and • 11% (84) of our students are students with disabilities.
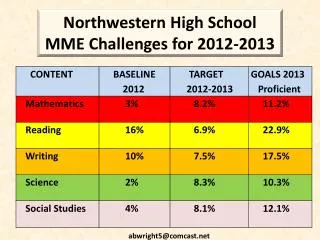
Trend Analysis: Academic Achievement - SHS Overall - % Proficient or Advanced Notable trends in overall achievement. The gains seen in 2012 Reading and Writing in 9th grade were fairly stable in 2013. The 10th grade Math scores over the past three years have increased 18.3 points. Tenth grade Science scores have increased 15.9 points. Upward trend is likely due to increased numbers of students in advanced classes and high academic expectations for all.
Academic Growth - Math • SHS Overall State Expectation Notable trend in Median Growth Gap and Adequate Growth Gap. The gap between Median Growth and Adequate Growth has decreased 13% points.
Academic Growth Gaps – Reading Notable trend in Median Growth Gap and Adequate Growth Gap. The gap between the two populations was 18% in 2011 and 4% in 2012. Students with Disabilities outgrew the overall population growth in reading by 2% in 2013. The Students with Disabilities subgroup did not meet the Median Adequate Student Growth Percentile, but its Median Student Growth Percentile for Reading was 63, rating a Meets. Success was attributed to increased progress monitoring of fluency, vocabulary, and comprehension skills, using YPP, and adjusting strategic and intensive instruction based on monitoring. Increased instructional time through Mastery Reading and Strategic Reading classes was realized. Increased efficient use of instructional time due to the implementation of positive behavioral supports was achieved.
Academic Growth Gaps – Writing The Median Growth Percentile in Writing for Students with Disabilities when compared to the Median Growth Percentile for students overall suffered a slight dip but is stable. The gap between the two populations was 17% in 2011, 10% in 2012, and 11% in 2013. The Students with Disabilities subgroup did not meet the Median Adequate Student Growth Percentile for Writing, but its Median Student Growth Percentile was 55, rating a Meets expectations. Successes were attributed to provision of interventions in Strategic Writing (increased instructional time and opportunities to provide feedback to students about their writing), provision of increased academic rigor for all students as a result of raised academic expectations through exposure to high level of curriculum, and increased progress monitoring of skills and adjusting instruction based on monitoring. Increased efficient use of instructional time due to the implementation of positive behavioral supports was achieved.
Academic Growth Gaps – Math The Median Growth Percentile in Math for Students with Disabilities when compared to the Median Growth Percentile for Non-Disabled Students increased in 2012 but decreased in 2013. The gap between the two populations was 13% in 2011, and -9% in 2012, and 12% in 2013. The Students with Disabilities subgroup did not meet the Median Adequate Student Growth Percentile for Math, but its Median Student Growth Percentile was 50, rating an Approaching expectations. Successes were due to provision of standards-based assessments, provision of interventions in Math Labs (increased instructional time and opportunities to provide feedback to students about their mathematics), and provision of increased academic rigor for all students as a result of raised academic expectations through exposure to high level of curriculum. Increased efficient use of instructional time due to the implementation of positive behavioral supports was achieved. Root causes for stagnation of student growth and decrease of academic growth for students with disabilities included insufficient differentiation to meet students where they’re at and inadequate progress monitoring of skills and the needed adjustment of instruction based on this monitoring.
Graduation Rate (2013 rate will be reported out by State in January, 2014)
Incidents2012-2013 compared to 2011-2012 40% decrease in drug violation incidents 24% decrease in total incidents 41% decrease in out-of-school suspensions 64% increase in in-school suspensions 77% decrease in number of incidents referred to law enforcement
Major Improvement Strategy #1:Using Data Teams tomaximize positive feedback loops that are reinforcing (SBG rubrics and/or YPP) and negative feedback loops that are self-correcting (engagement, SBG rubrics, YPP)
Major Improvement Strategy #2: Family/School/Community Partnering